

When people ask me where I publish my work, the unsatisfying answer I’ve always had to give is “it’s all on Twitter.” You see, the election mapping community emerged rather organically and haphazardly online; most of us make maps purely for fun and no central site exists to display our work.1
Now that I have a blog, I’m changing that for myself. This living page will showcase maps I’ve enjoyed making, introducing you to the fascinating stories they unlock.
Enjoy!
Table of contents
Historic election maps
The Federalists’ last gasp
A glimpse into Cambridge’s competitive era
Cleveland carries Cambridge, a first for Democrats
A 100-point shift in one year?
The three-way 1912 presidential election in Boston
The socialist vote in 1920s Boston
Coolidge’s victory in Boston, the end of a Republican era
Boston becomes a Democratic bastion
Al Smith’s win visualized by congressional district
Modern election maps
An introduction to modern voting trends
How Massachusetts voted in 2020
Ross Perot falls flat in Boston
The best-performing candidates since 2000 in Southern New England
The mystery of a prominent state line
The evolution of third-party voting in Southern New England
Realignment in the Upper Midwest
A shorthand for Massachusetts’ countercultural centers
A case study in misleading New England county lines
Behind Nikki Haley’s loss in New Hampshire
Where Mitt Romney struggled despite being at home
Demographic maps
Where Massachusetts’ ethnic whites lived in 1910
How Hispanics in Massachusetts are distributed
Income and education in the Boston area
Income and education in New England
Where Irish and Italians marry each other
How New England’s most common ancestries are distributed
Historic election maps
The Federalists’ last gasp
Just over two centuries ago, Massachusetts elected a Federalist governor for the last time. Six-term incumbent John Brooks, a physician and Revolutionary War veteran, beat Republican Rep. William Eustis.
In most of the country, the Federalist Party declined swiftly after the War of 1812. However, Massachusetts was the party's historic base. By 1822, though, it was beginning to lose its grip on Boston politics; a reform-hungry citizenry was finally turning on the Federalist elite. Although Brooks was a staunch Federalist, he shrewdly hid his allegiances and governed with a moderate tone, appointing many Republicans to public office. He distanced himself from the more radical elements of his party; even James Monroe praised him while visiting Boston.
The Federalists appealed to merchants and traders who profited from commerce; coastal ports like Newburyport and New Bedford supported them heavily. Federalist towns tended to have industrial economies, clear social hierarchies, and stable religious institutions. Hampshire County was the Federalists' strongest bastion in Massachusetts. Linked to the prosperous cities of Hartford and New York, it was a traditional Yankee commercial hub. Brooks earned near-unanimous support in Hadley and Southampton.
Most of Essex County was strongly Federalist, but the towns on its periphery were much less so. Republicans in the legislature noticed this; in 1812, they drew an Essex state senate district to favor their party, avoiding Federalist bases by snaking along the Merrimack River. Their brazen partisan intent led a newspaper to deem it "the Gerry-Mander," after Republican Elbridge Gerry. Although it no longer existed by 1822, the district's effectiveness was still apparent. Eustis narrowly won it, while the rest of Essex went for Brooks in a landslide.
To map this historic race by municipality, I drew the town shapefile from scratch.
A glimpse into Cambridge’s competitive era
Before Al Smith came along and realigned Northeastern urban politics, Cambridge was an extremely competitive city. As a native, I was shocked to learn this, having only known the version of Cambridge notorious for its lopsided politics. Originally a Republican stronghold, the city’s competitiveness increased along with its Irish population, which concentrated in the newly developed industrial neighborhood of East Cambridge. Meanwhile, Old Cambridge (modern-day Harvard Square) remained staunchly Republican even past 1924, thanks to its strong contingent of worldly professorial types who didn’t see themselves in the urban-immigrant heavy Democratic Party of the time.
This was my first foray into creating a gallery-style view with my maps, and I loved how it turned out so much I got it printed and framed!
Cleveland carries Cambridge, a first for Democrats
The below text is copied from my article, “Purple Cambridge.”
The 1884 campaign brought a major shakeup to the Republican Party. The national convention selected James G. Blaine, a Senator with a reputation for scandal. One incident stood out: while he was Speaker of the House, Blaine accepted bribes from railroad companies. Letters substantiating the charges were widely circulated (Winick, 2016). A group of Republican activists, united by their steadfast opposition to corruption, decided to abandon their nominee. These voters, known as Mugwumps, were especially prevalent in Massachusetts. Indeed, “conscience-soaked Boston was undoubtedly the Mugwumps’ nest” (Wood, 1960, p. 435). Such figures as widely revered President of Harvard Charles W. Eliot and prominent editor Charles Francis Adams declared their support for Democratic nominee Grover Cleveland; three traditionally Republican newspapers in Boston endorsed him (Muzzey, 1934, p. 295). Yet although the most high-profile Mugwumps in Massachusetts were established intellectuals, the movement also attracted many young Republicans already upset with the state party. Old-guard politicians dominated the upper ranks of the party’s hierarchy, fomenting discord among aspiring leaders clamoring for mobility. Edward Everett’s son, William, complained that “the old men of the party are doing their best to snub the young men of the party who would like to belong to it” (Wood, 1960, p. 436).
Massachusetts Democrats, meanwhile, had their own schism to ponder. Their growing Irish-American contingent increasingly felt that the “old Yankee element” of the party was taking them for granted (438). Benjamin Butler, running as a Democrat, exploited their anger to win the governorship in 1882 to the Brahmins’ chagrin (438). In 1884, he contested the Democratic presidential nomination, denouncing Cleveland as a “respectable” (439). Cleveland, a reformer who loathed the political machines Butler so deftly leveraged, was “the type of politician Butler abhorred” (Trefousse, 1956, p. 187). At the convention, Butler tried determinedly to influence the platform, but his entreaties were repeatedly rejected (188). When it became clear that Cleveland would be selected as the nominee, Massachusetts’ Irish party leaders turned apprehensive. They dreaded the concept of voting for the Mugwumps’ candidate and were suspicious that Cleveland would not stand firmly behind Catholics and laborers (Wood, 1960, pp. 439–440). The editor of the Democratic-leaning Boston Pilot reacted with alarm, writing that Cleveland’s nomination was “Democratic suicide” (Cambridge Chronicle, Aug. 2, 1884). A furious Butler launched an independent campaign for president; local outlets took his campaign seriously, believing his presence on the ballot would cause substantial Democratic defections. In September, the Chronicle remarked that Butler’s movement “seems to be a strong one” (Sep. 27, 1884).
Yet heading into the campaign’s home stretch, Cambridge Republicans were not inspiring confidence. When the calendar turned to October, the Republican city committee had still failed to organize a ratification meeting for Blaine’s candidacy — something that their counterparts in “every other city and town in the State” had already attended to (Chronicle, Oct. 4, 1884). Two weeks before the election, the committee was running short on funds. “What Have They Done With The Money?” asked a Chronicle headline on October 25. “All admit that some of the wealthy members of the party have gone over to the mugwumps,” the story contended, “but for all that there should be money enough.” Reflecting the intraparty divisions among the Republicans, the editors produced a rather tepid endorsement of Blaine: “while we are not of those who believe that any election will result in ruining the country,” they wrote, “it is yet our firm conviction that her best interests demand a continuation of Republican rule” (Chronicle, Nov. 1, 1884).
The Mugwumps’ impact was as advertised. Cleveland won the city and the election, becoming the first Democrat ever to carry Cambridge. Remarkably, his strongest performance came in Ward 1, where he defeated Blaine 58–35. This was a whopping 55-point Democratic swing from 1880; up to this point, Old Cambridge had reliably been Democrats’ worst neighborhood in presidential races. The Chronicle, comparing the performances of Blaine and downballot Republicans, concluded that “about 475 Cambridge Republicans bolted Mr. Blaine” (Nov. 8, 1884). Cleveland narrowly carried Ward 2, also a first for a Democrat. Butler’s impact, on the other hand, was far smaller than anticipated: he did split the Democratic vote in East Cambridge, collecting 14% in Ward 3, but that was nowhere near enough to jeopardize Cleveland’s win. The Chronicle predicted that Butler would receive 1,200 votes citywide—he managed just 664 (Oct. 11, 1884).
Thanks to the combined effects of Butler and the Mugwumps, this was the only time between 1848 and 1924 that a ward containing Old Cambridge voted more Democratic than a ward containing East Cambridge.
A 100-point shift in one year?
Benjamin Butler, brash and unapologetic, a sui generis personality in Massachusetts politics, finally won the governorship on his fourth try in 1882, marking only the second Democratic victory in 30 years. A demagogue who relished in fomenting chaos, Butler's election infuriated most prominent Republicans, who prided themselves on gentility; they vowed to beat him in 1883, knowing full well he intended to use the governorship as a launching pad for a presidential bid.
Public interest in the 1883 election was remarkable — turnout exceeded that of the previous and subsequent presidential elections. The proper residents of the Back Bay detested Butler’s dictatorial, abrasive style; he barely cracked 10% of the vote there. But the next year, the Mugwumps propelled Grover Cleveland to a near-draw in this previously unflinchingly Republican neighborhood. One precinct swung an incredible 109 points, from a 95%-5% Butler loss to a 59%-40% Cleveland win!
The three-way 1912 presidential election in Boston
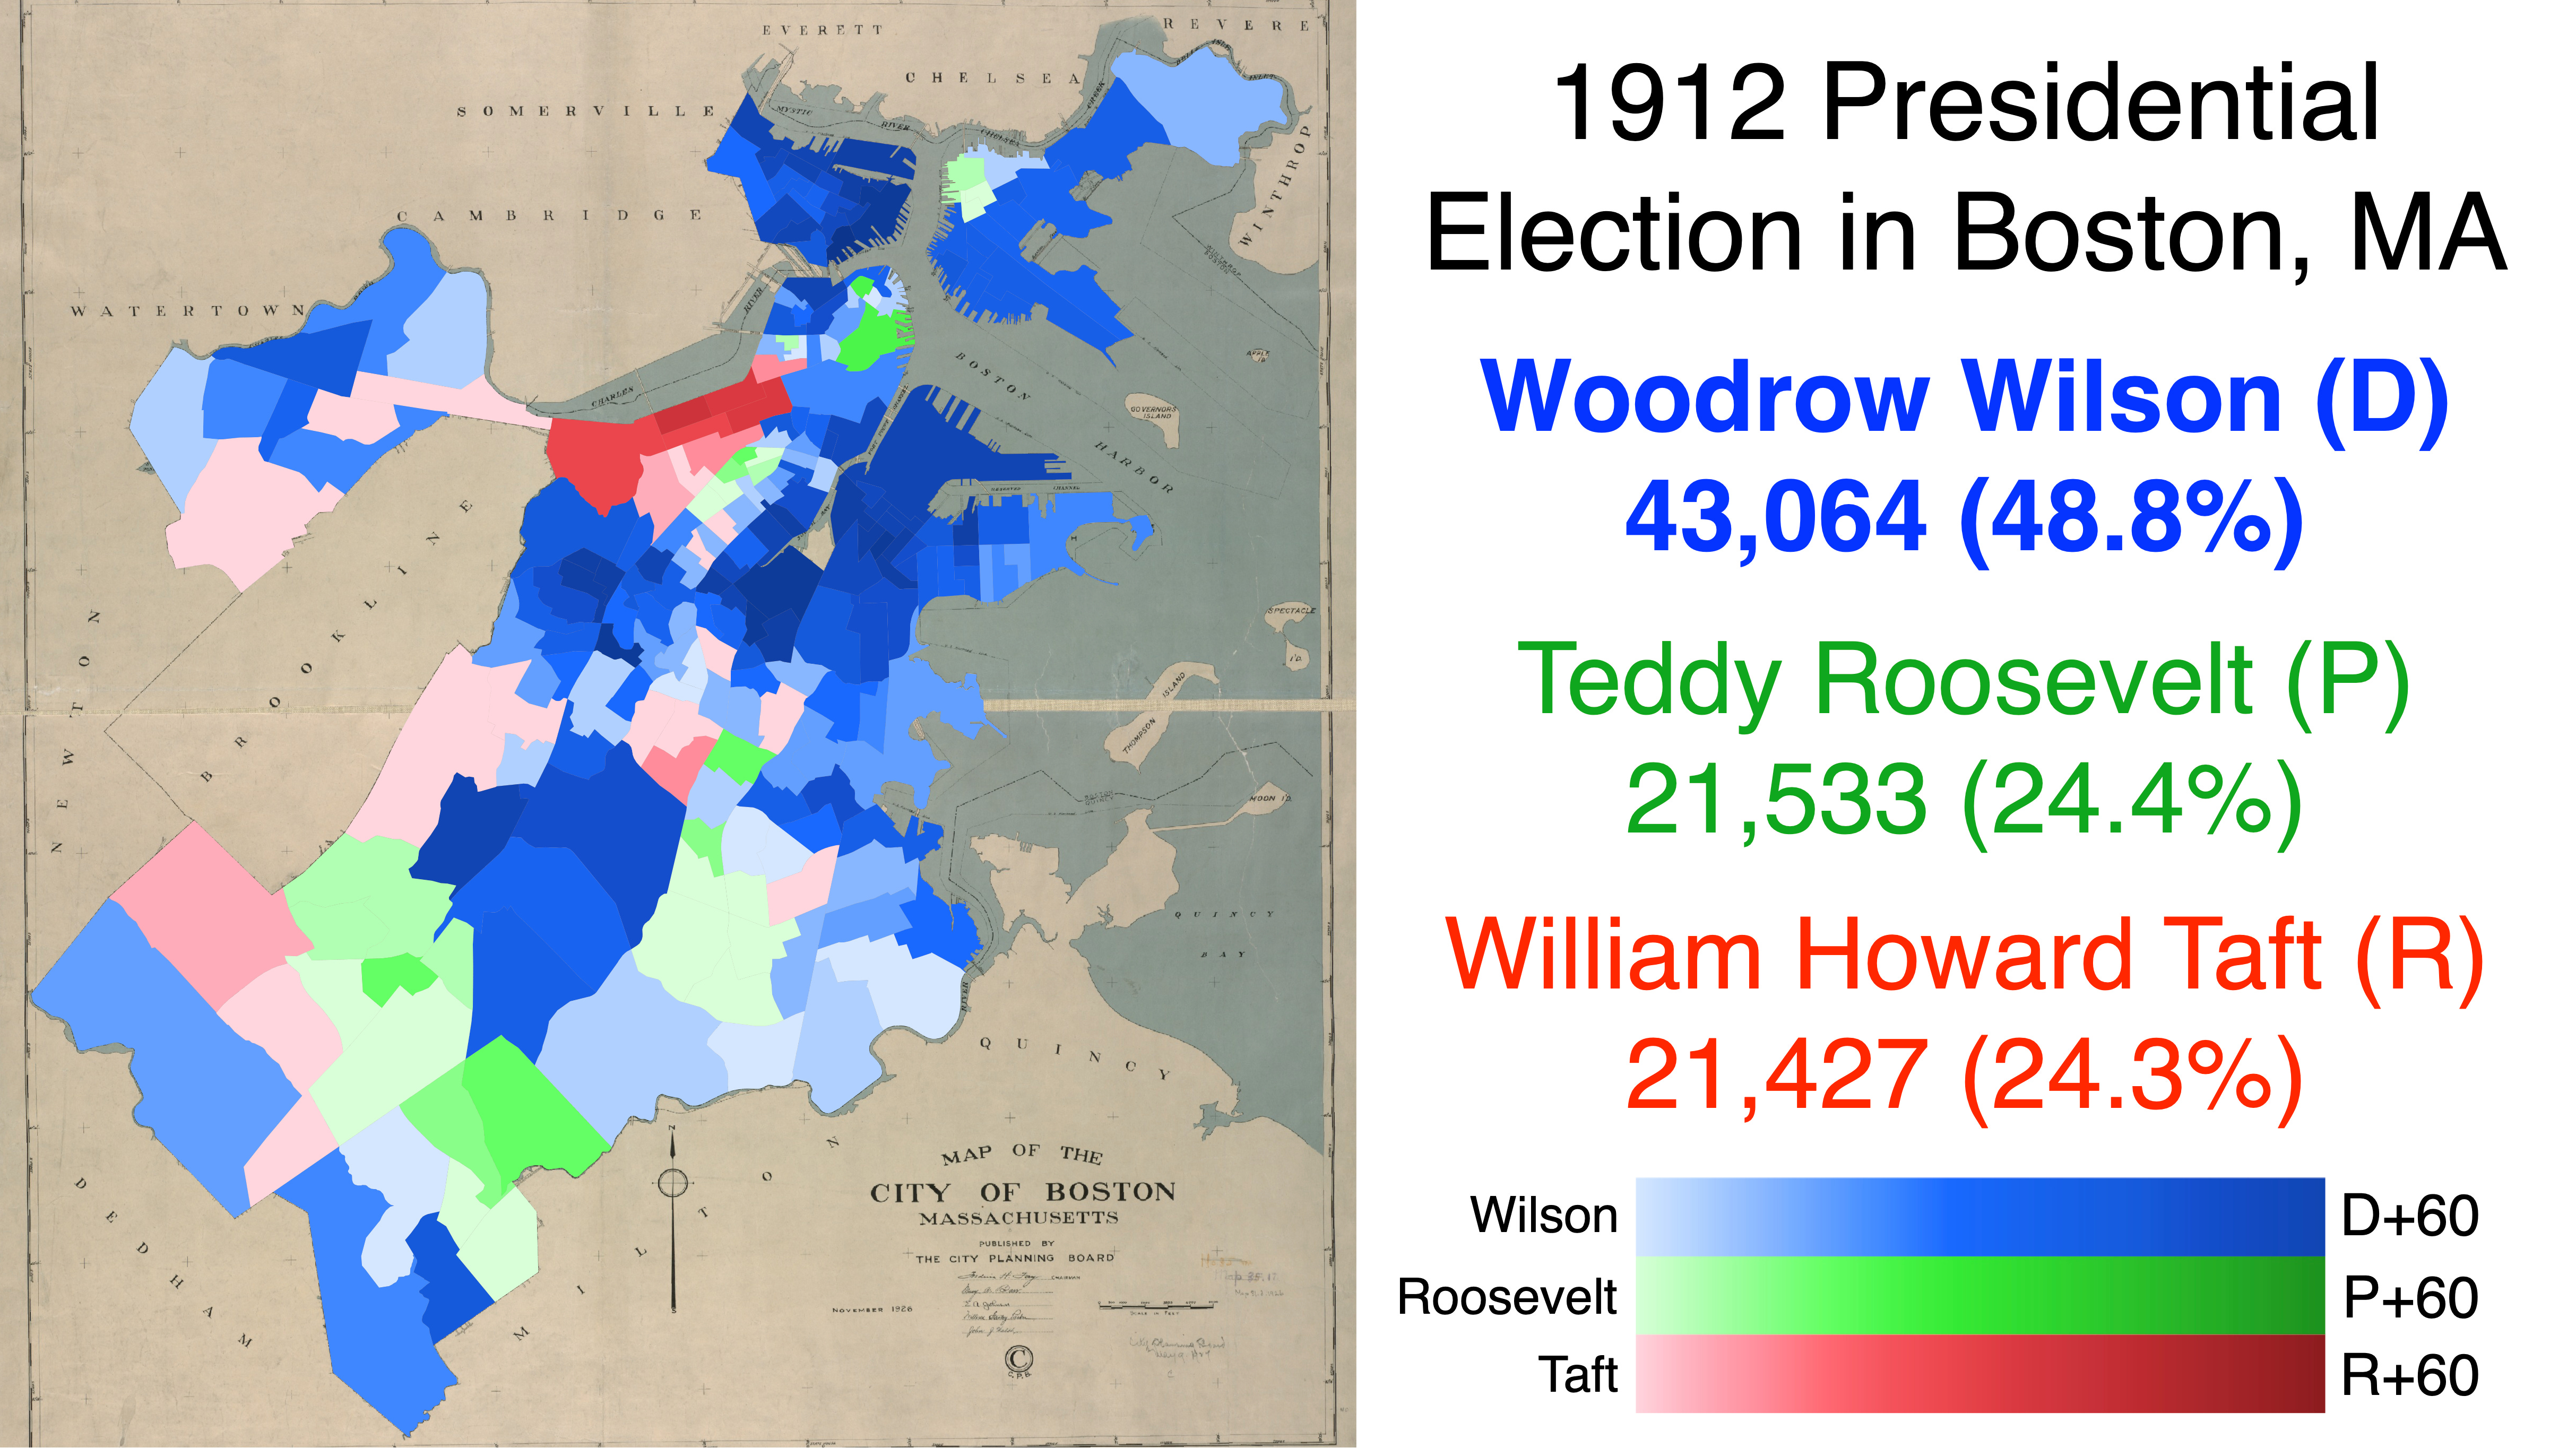
Mapping this race, which always fascinated me because of Roosevelt’s third-party run, was the first time I drew a large precinct shapefile from scratch.
To make a map, you need two things: the election data and a shapefile (which has boundary lines for the area you’re mapping). If you’re looking at a modern election, finding professionally-made shapefiles is a trivially easy task. Understandably, though, no one had taken the time to digitize Boston’s precincts from over 100 years ago. So I did it myself!
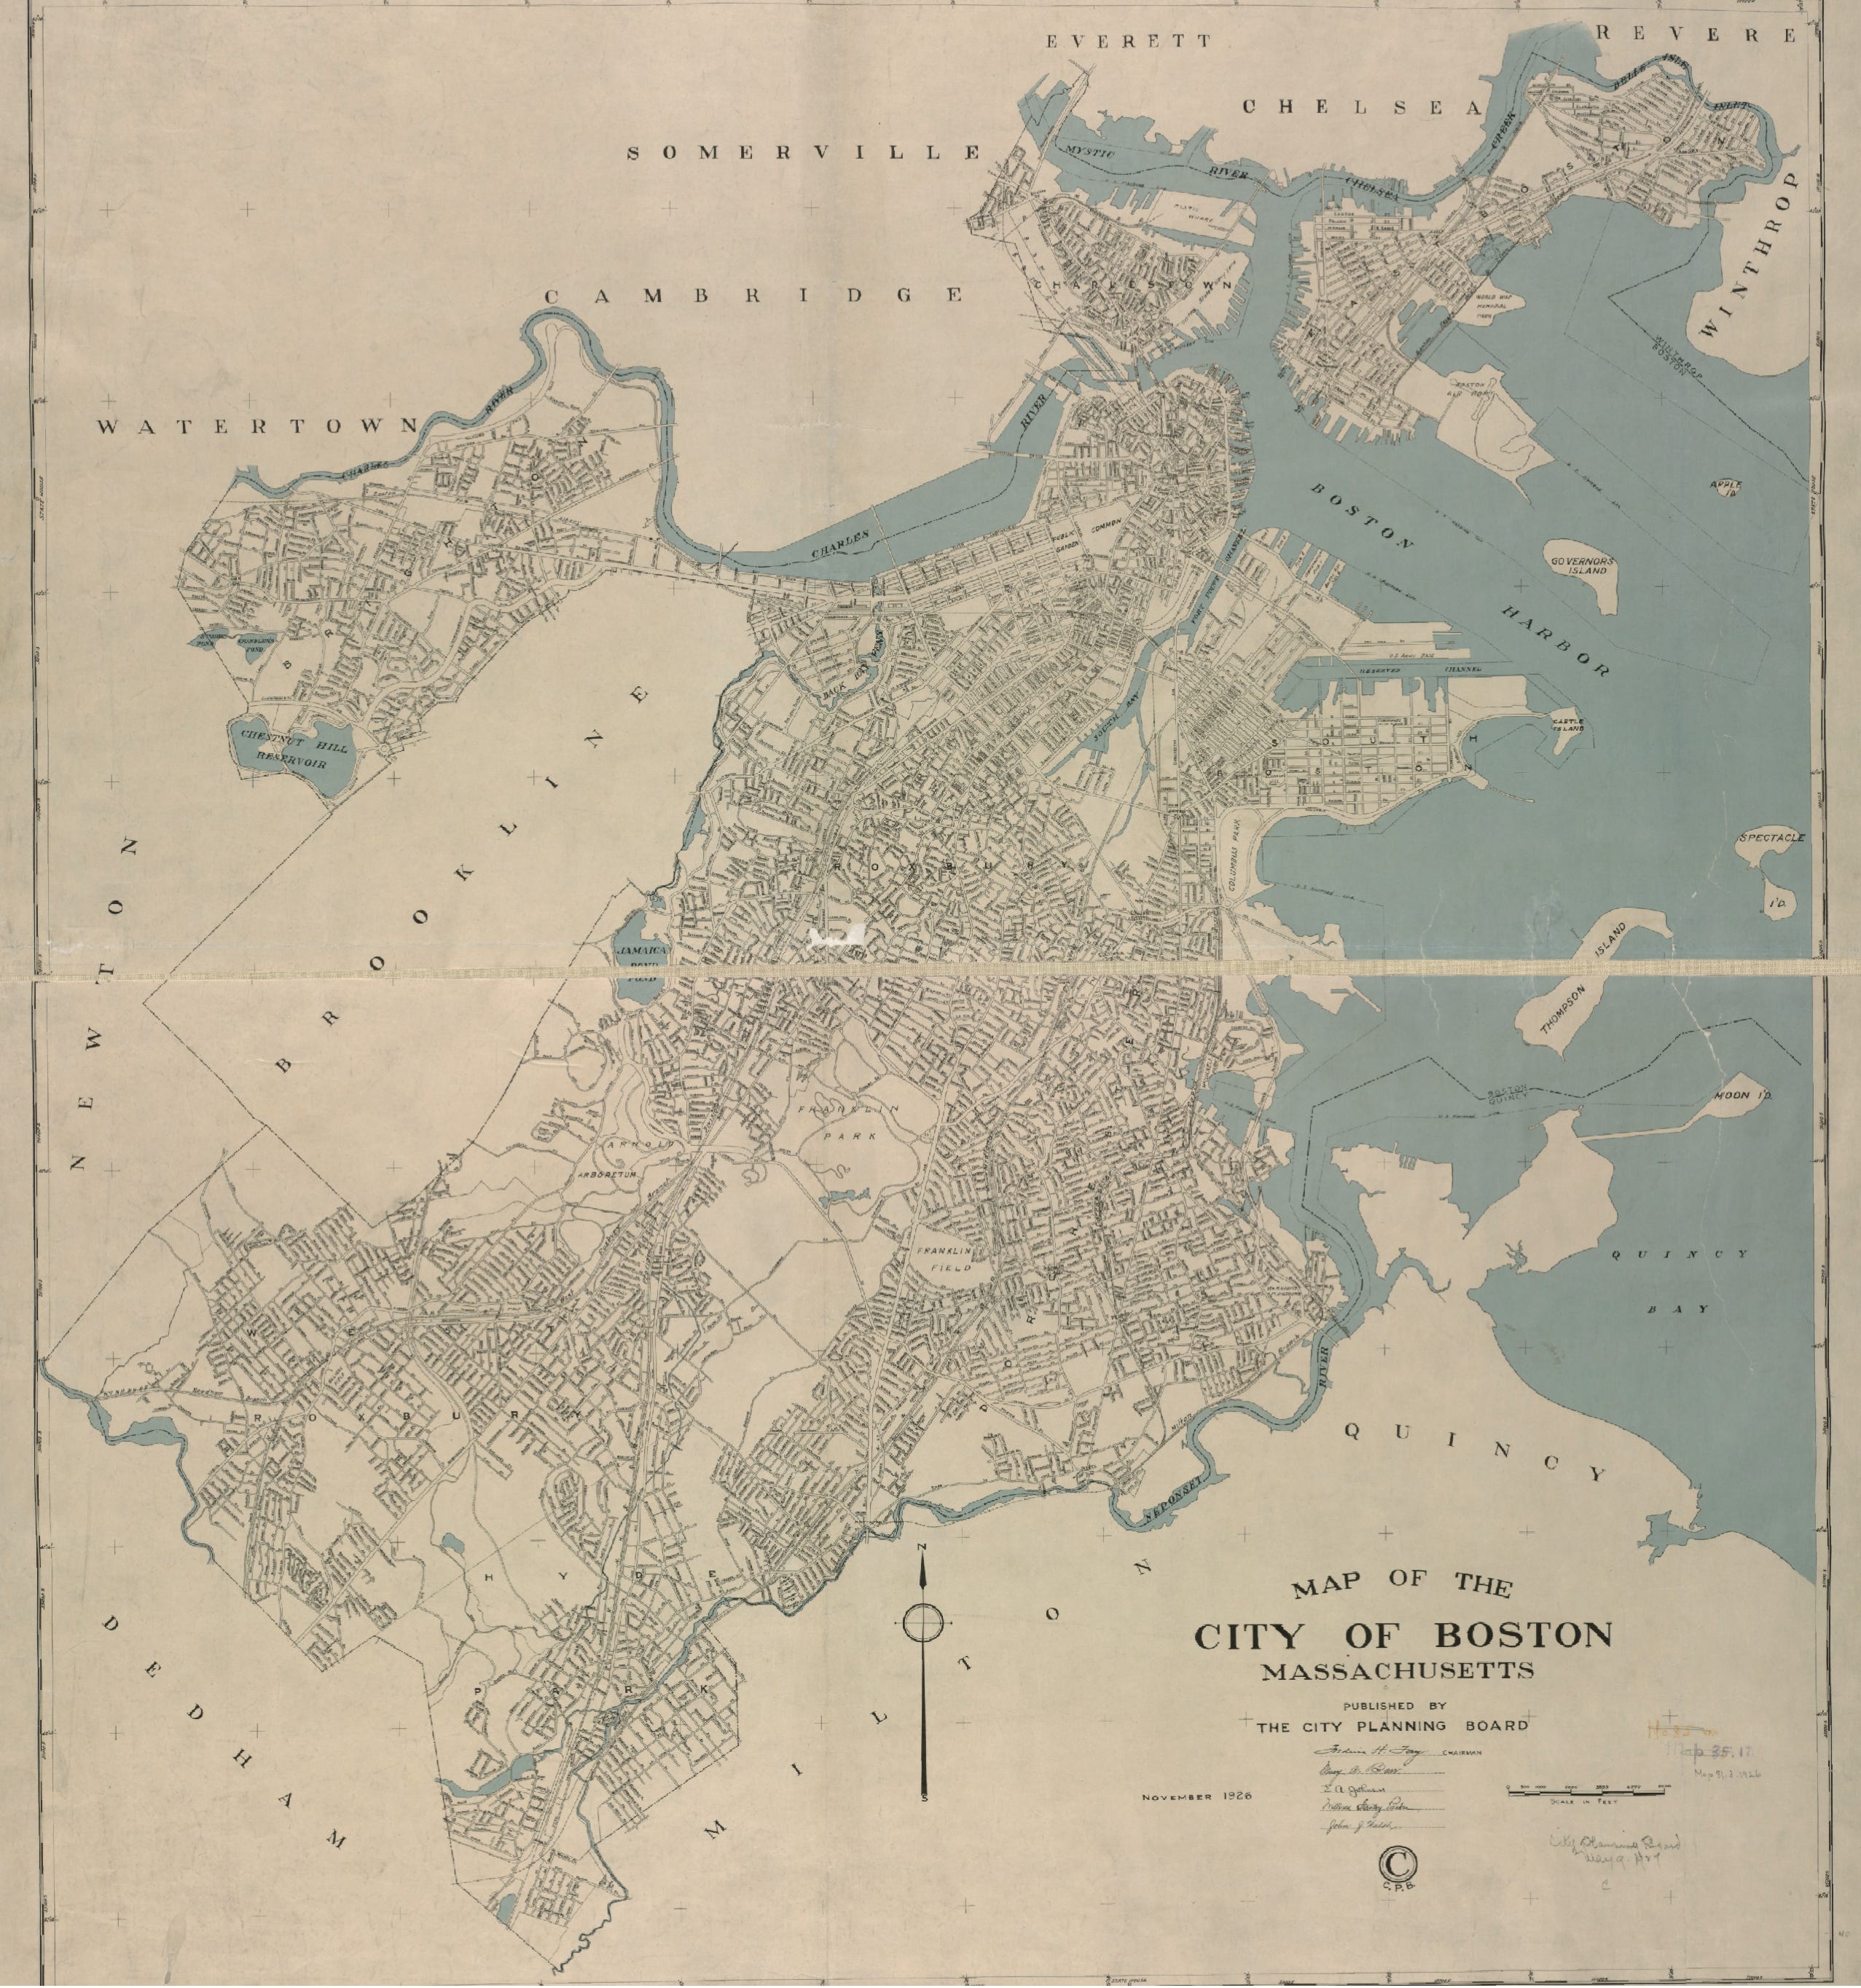
I loaded a contemporaneous background map into QGIS, the mapping software I use:
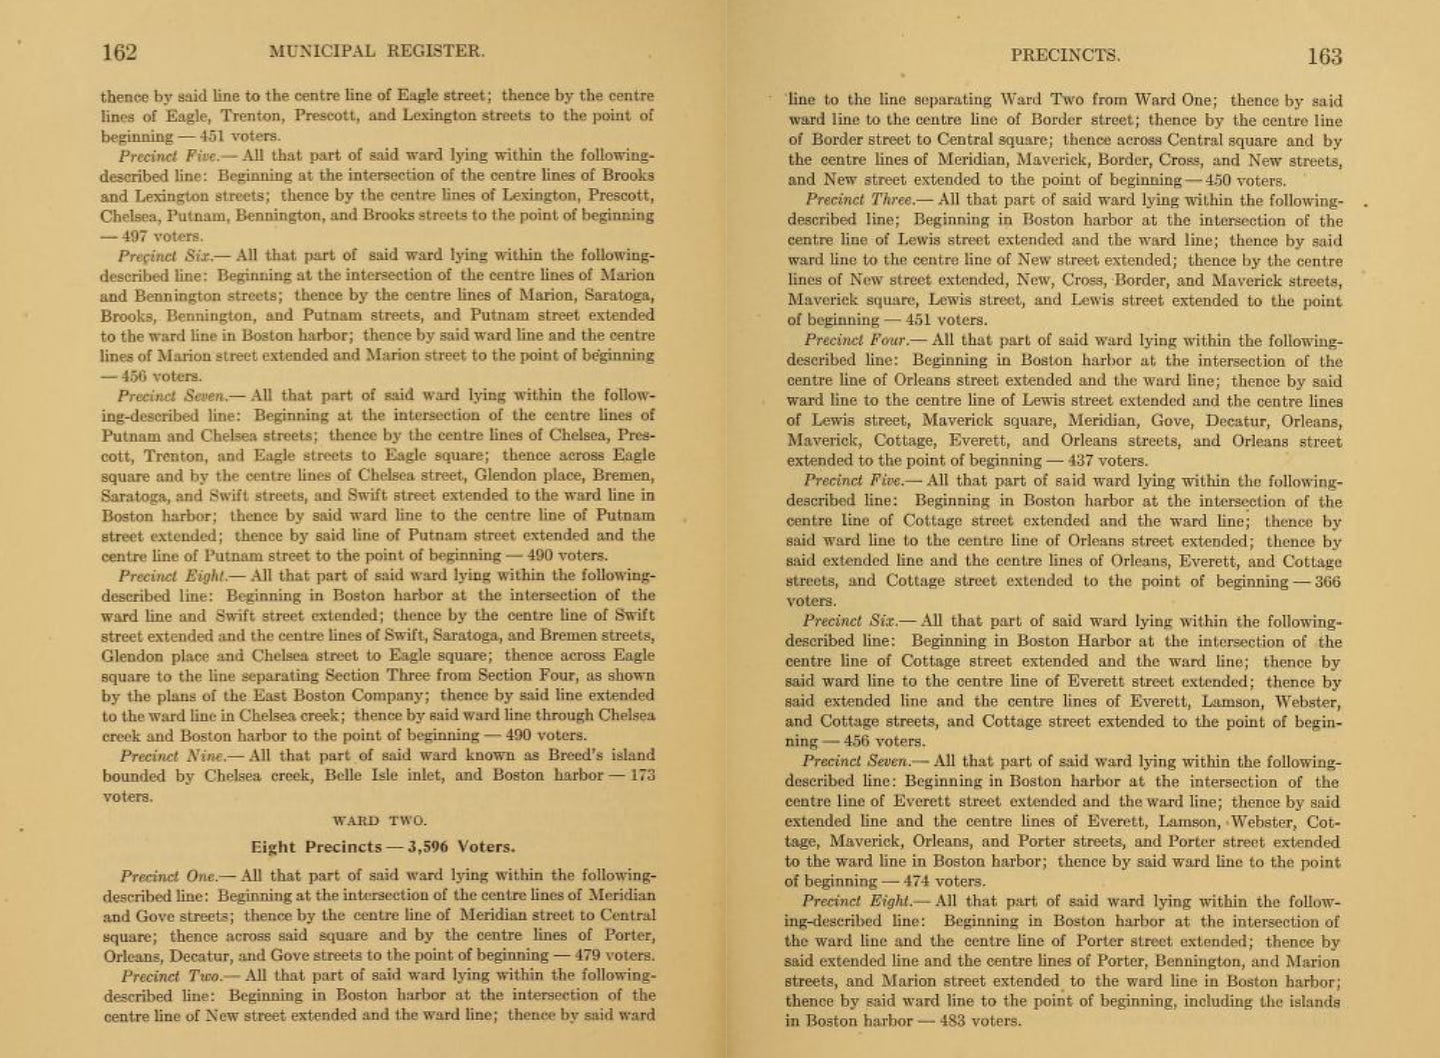
Then, I pulled up the Boston Public Library’s digitized municipal register books. These reference documents contain text descriptions of each precinct — enough information to draw precincts, one by one, tracing every line through mazes of streets, parks, and coastline:
This painstaking process took dozens of hours. It’s the kind of work that is just repetitive enough to tantalize you into thinking it’s easy, but tricky enough that you need to actively pay attention.


Additionally, because precincts needed to have equal numbers of voters and Boston was rapidly growing, the precinct map changed frequently. Observe the difference between Boston’s first map, inaugurated in 1878, and the precincts in use 47 years later!
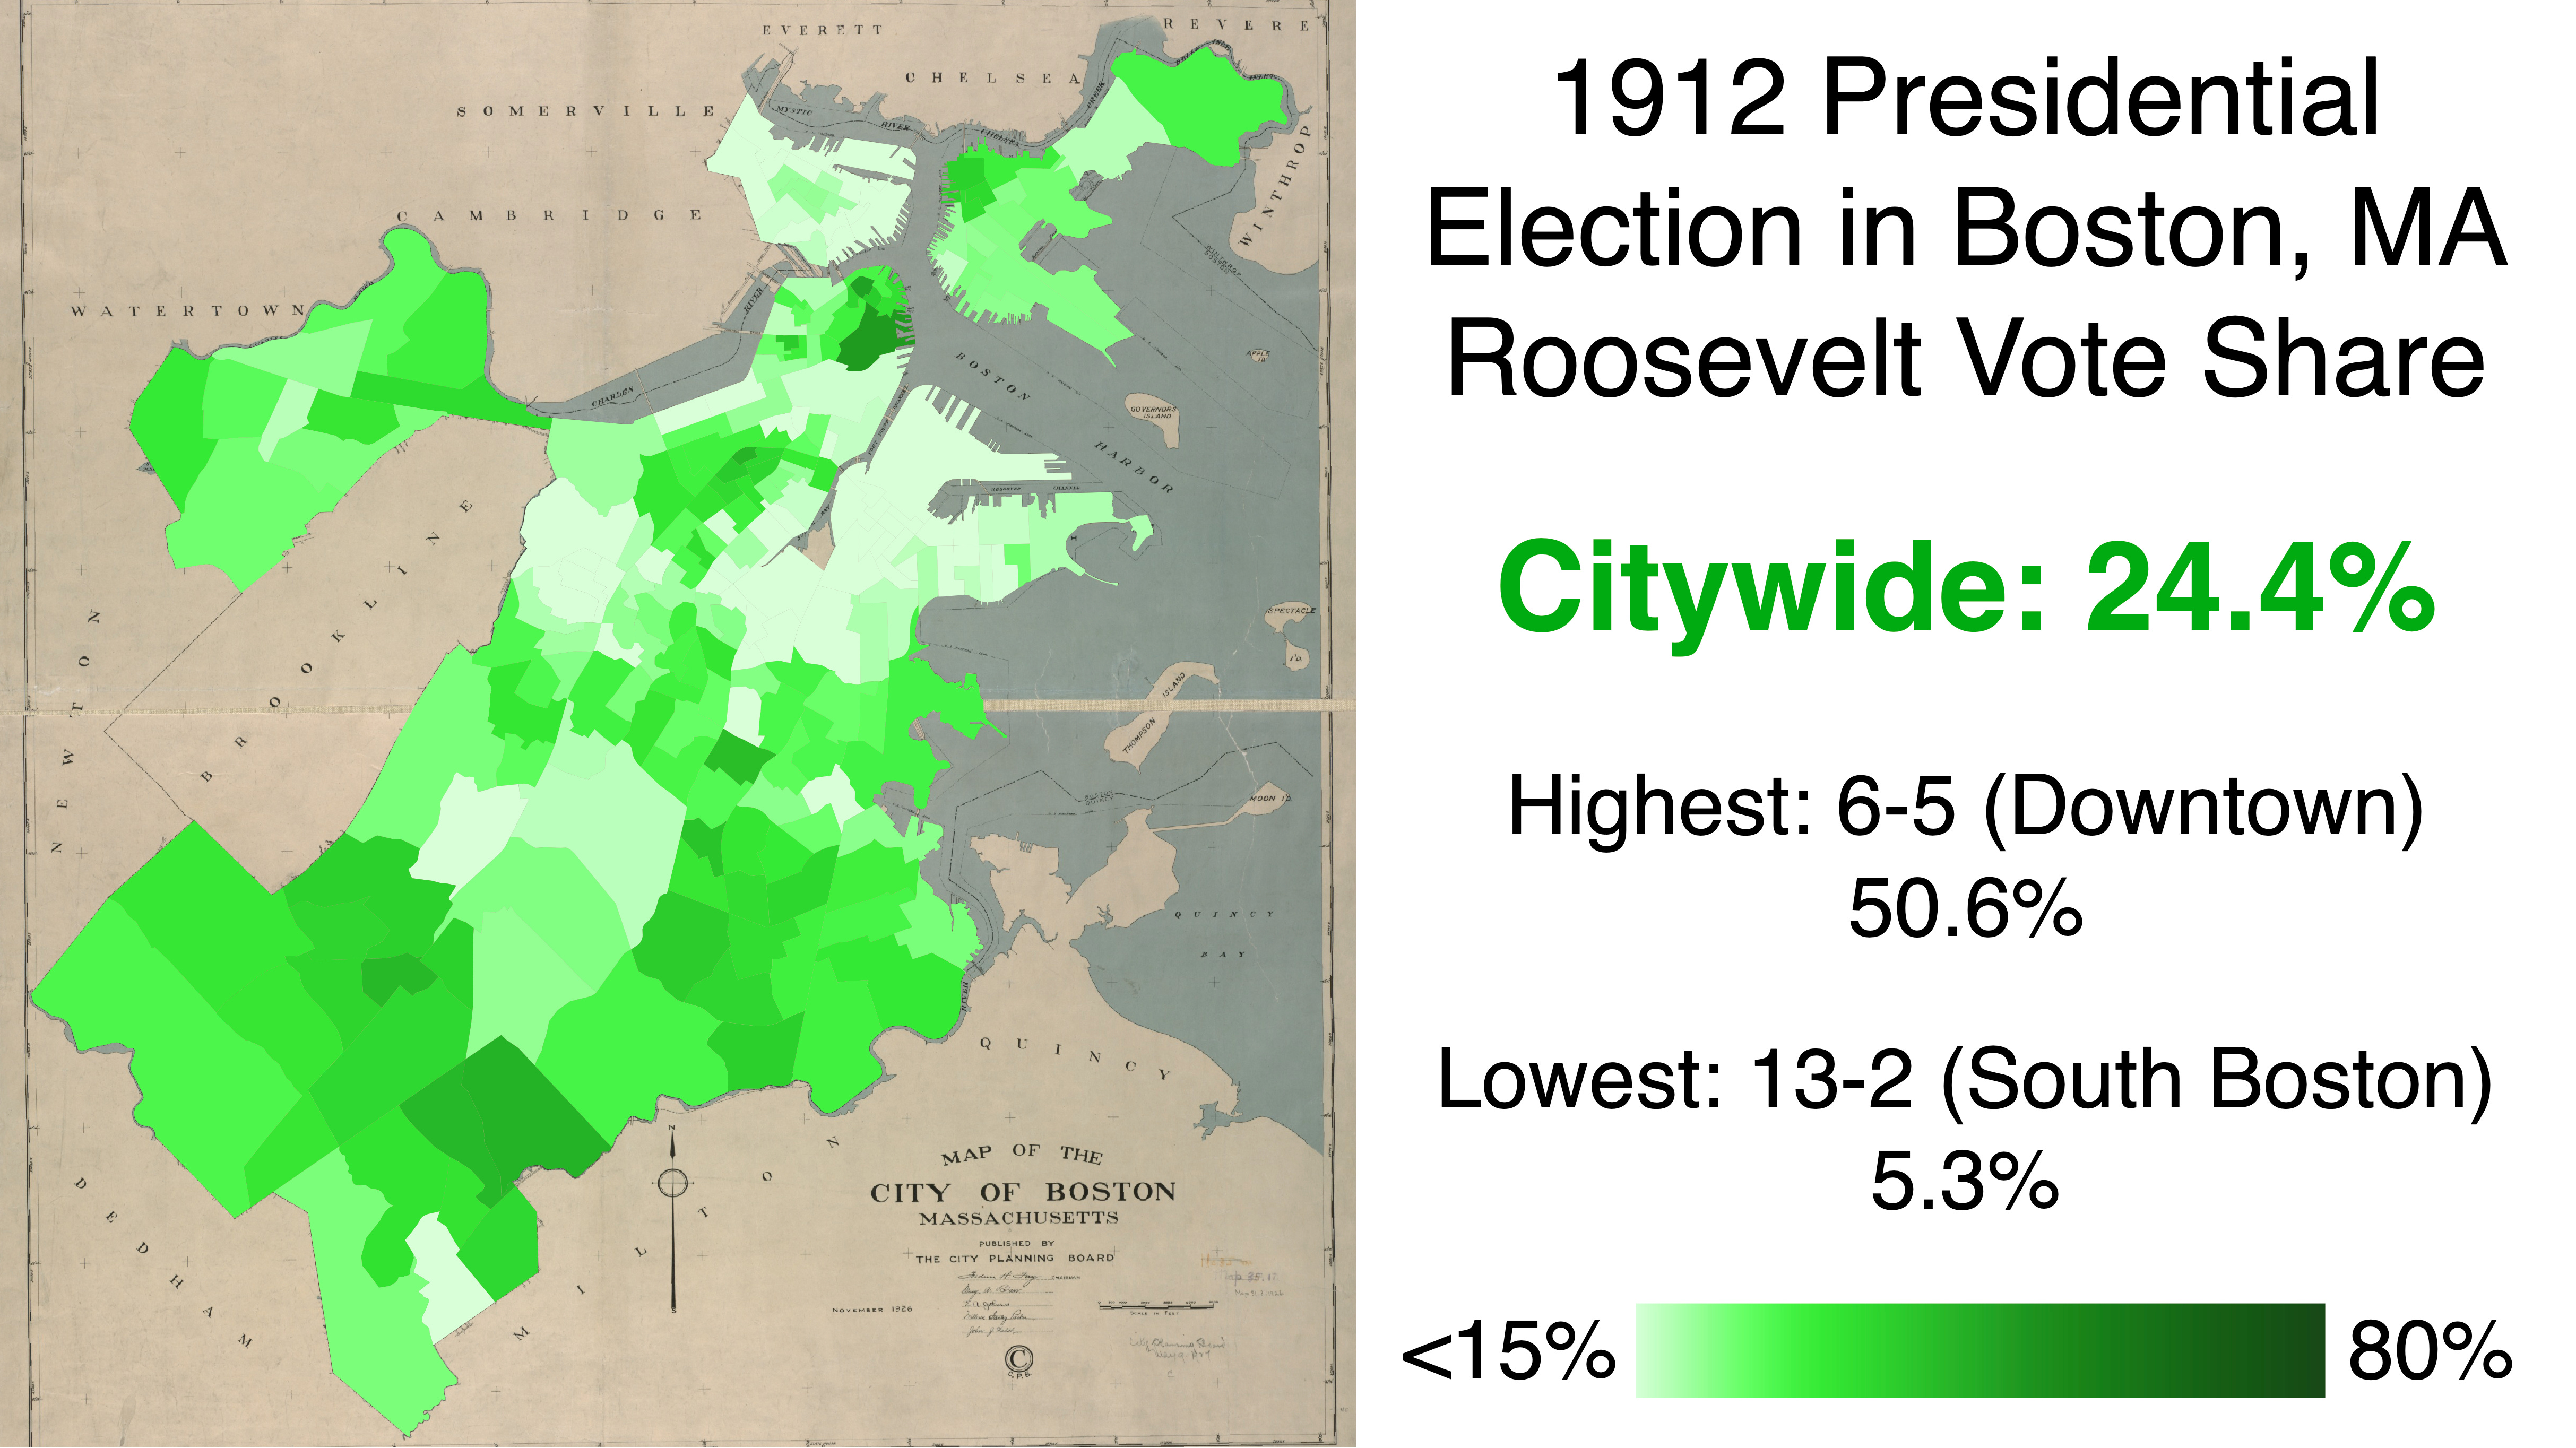
Now, back to 1912. As was the case for any Democrat of his era, Woodrow Wilson's strongest precincts were located in the heavily Irish sections of Charlestown and South Boston. President Taft did best with wealthy Yankee Republicans, few of whom defected to Roosevelt; in fact, Wilson came second in the Back Bay. Taft’s worst precinct was in the West End, a working-class area characterized by crowded tenements. Teddy Roosevelt failed to make inroads in loyally Democratic Irish areas, but fared well in the predominantly Italian North End and took substantial shares in normally Republican streetcar-suburban neighborhoods like West Roxbury and Dorchester.
The socialist vote in 1920s Boston
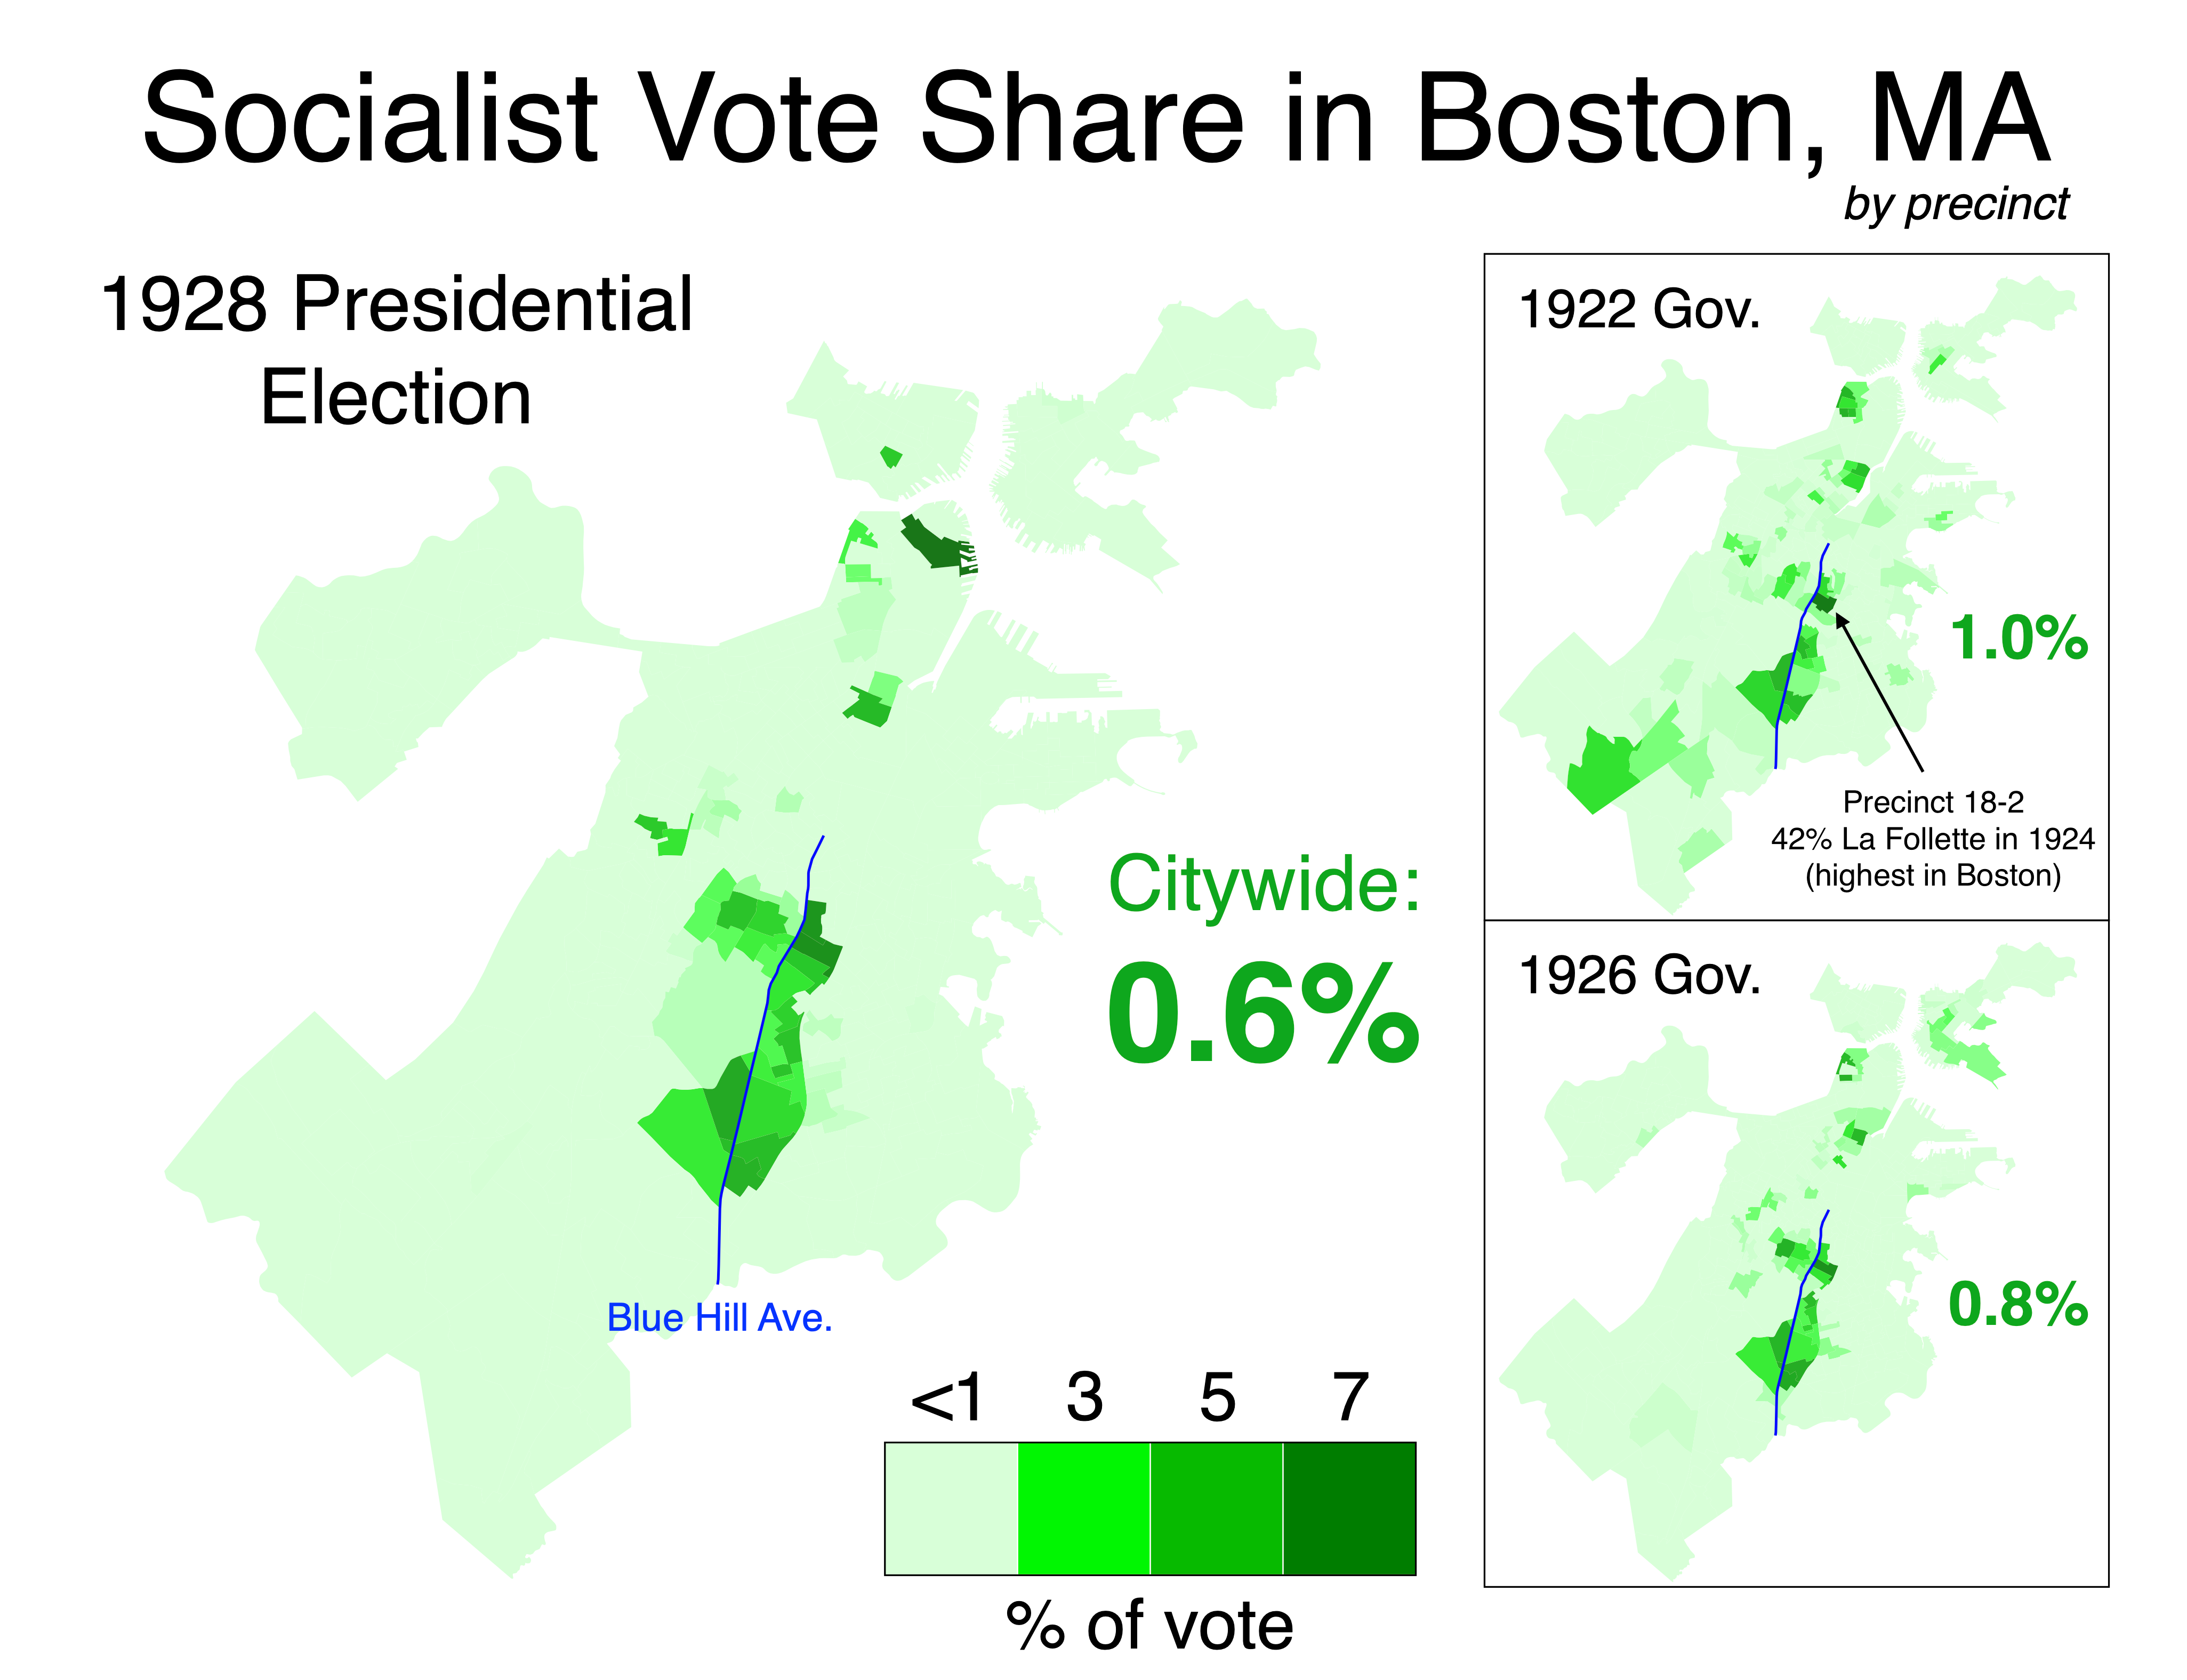
In the 1920s, socialist third-party candidates had a distinct base in Boston: precincts along Blue Hill Avenue, where the city's Jewish community had coalesced. Socialists often combined for as much as 5% of the vote in these areas — far stronger than their citywide performance. Jewish enclaves in New York City were also sympathetic to socialists during this time period.
This was a fun case of discovering a vividly clear pattern in old results (since they can often seem fairly random). This was the first time I tried to make my vote share legend a little sleeker, and I loved how it came out!
Coolidge’s victory in Boston, the end of a Republican era
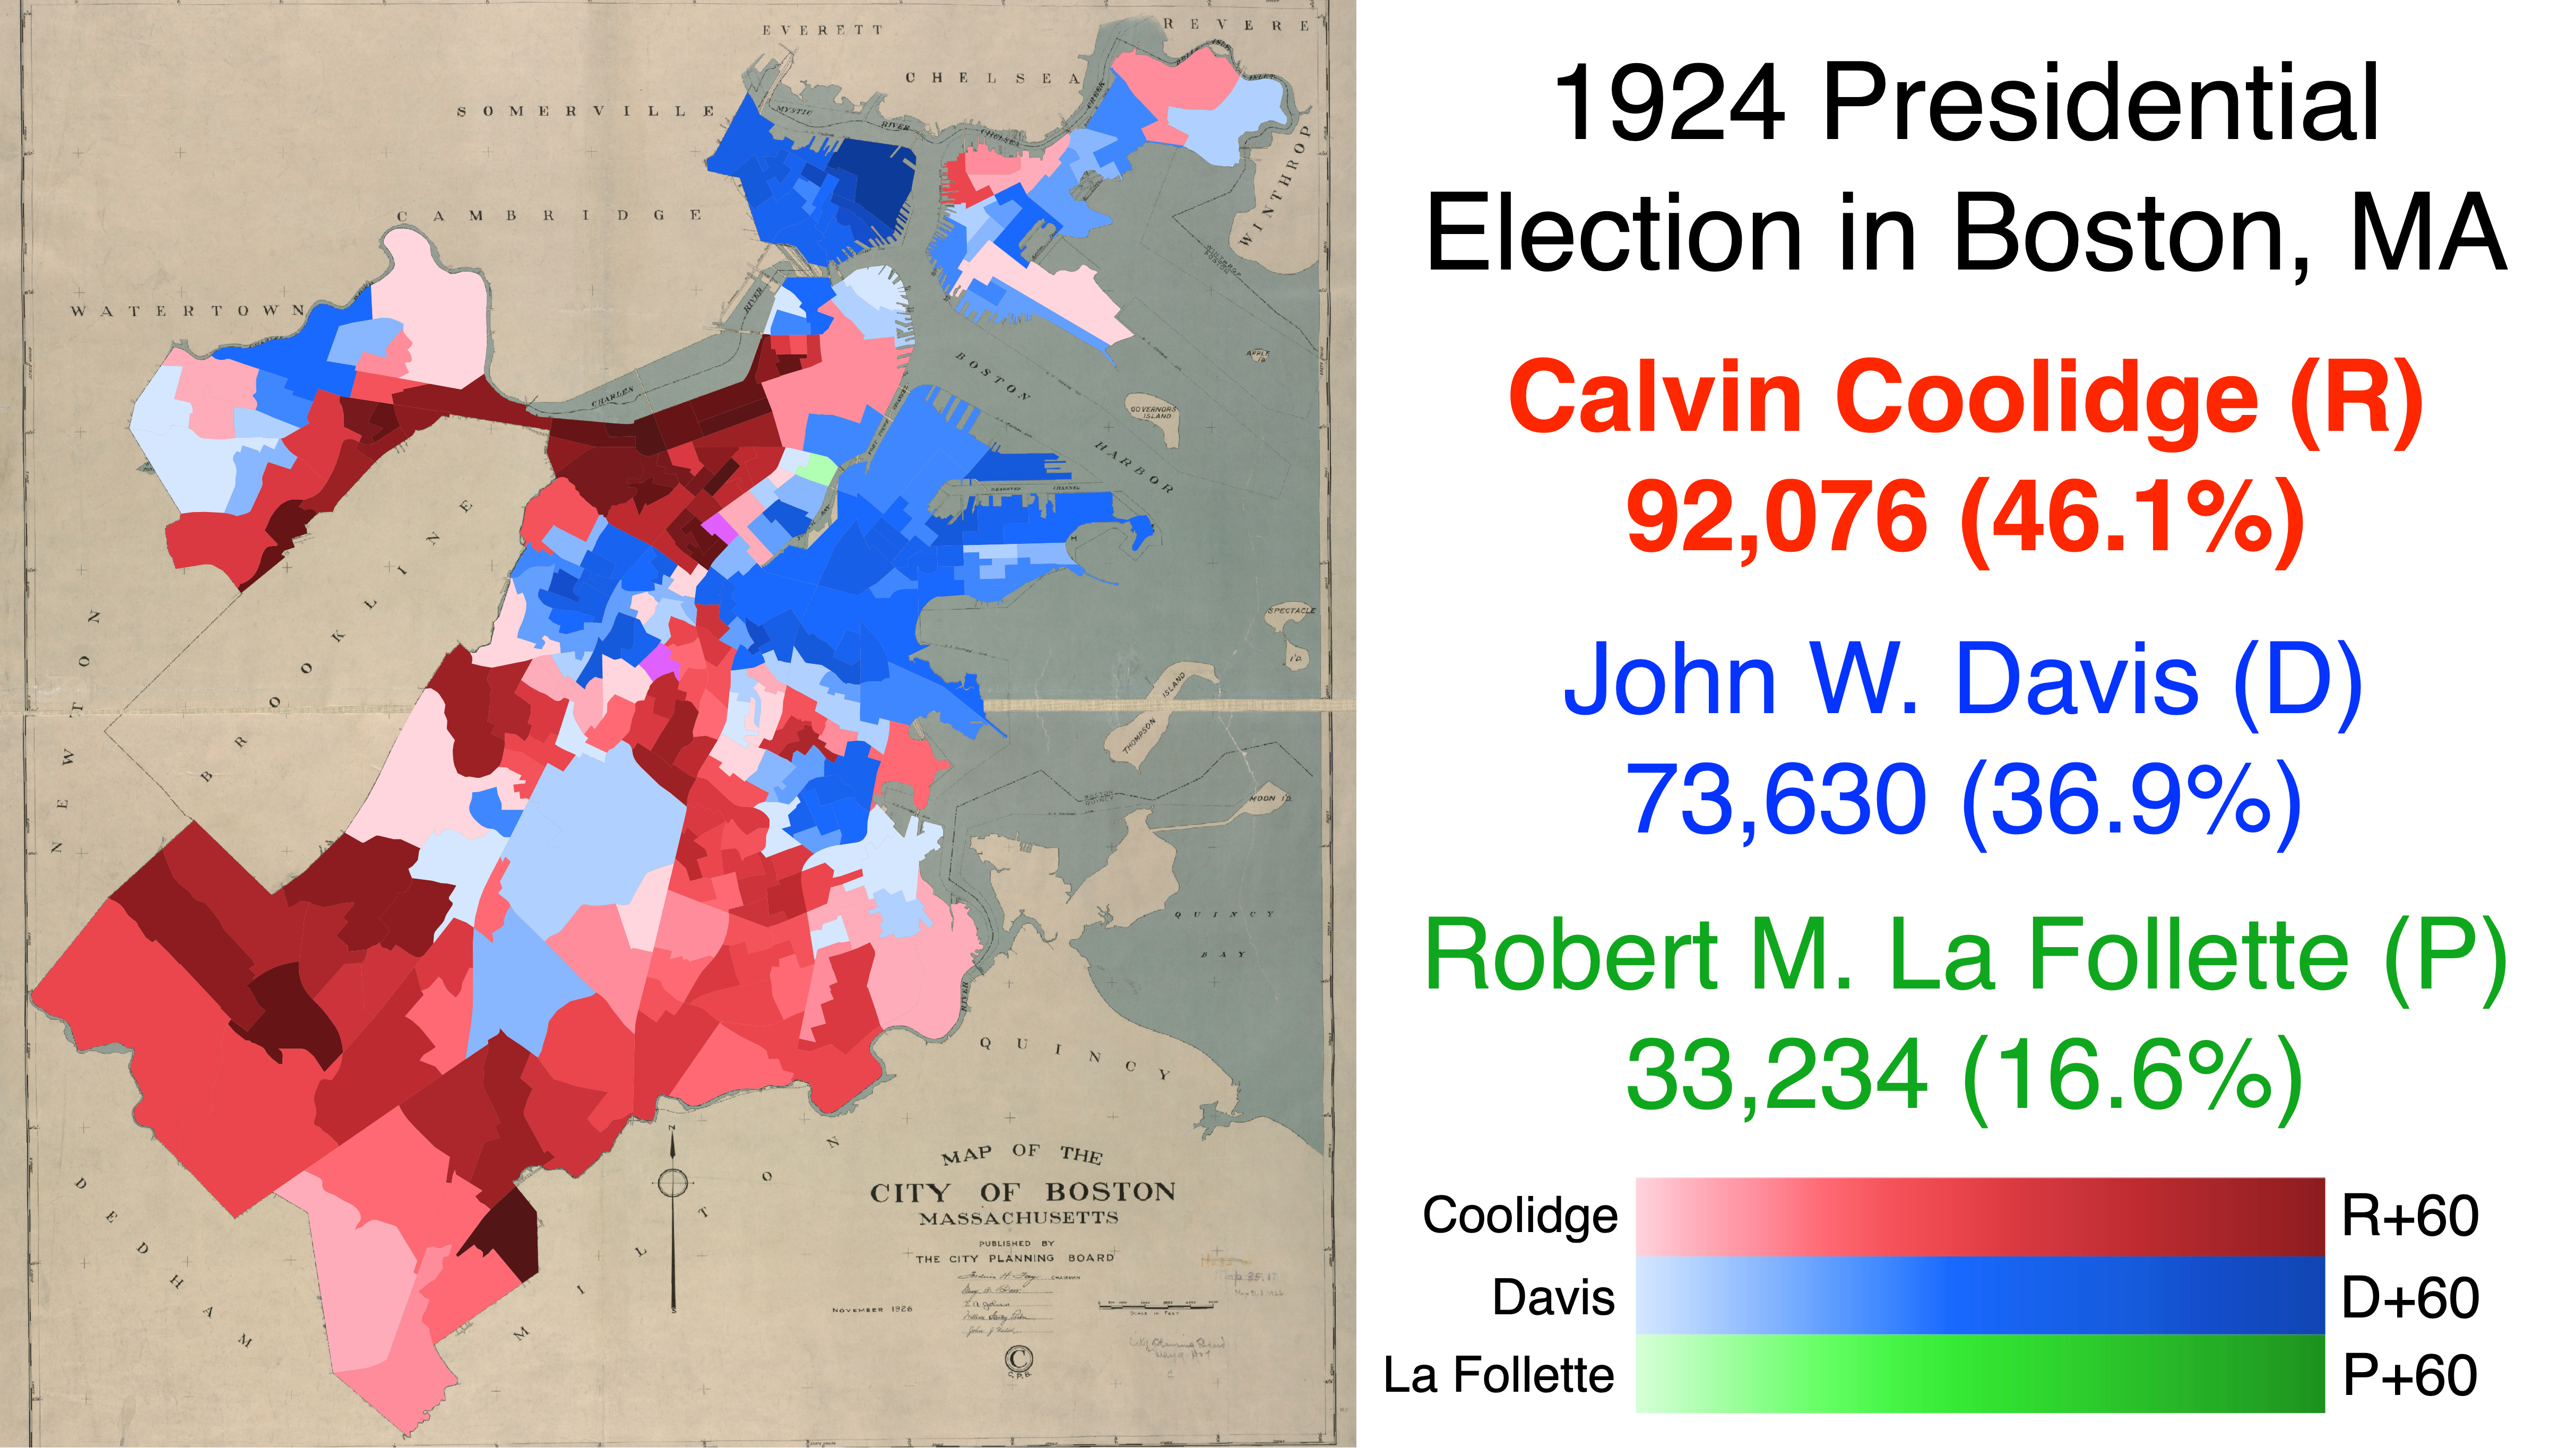
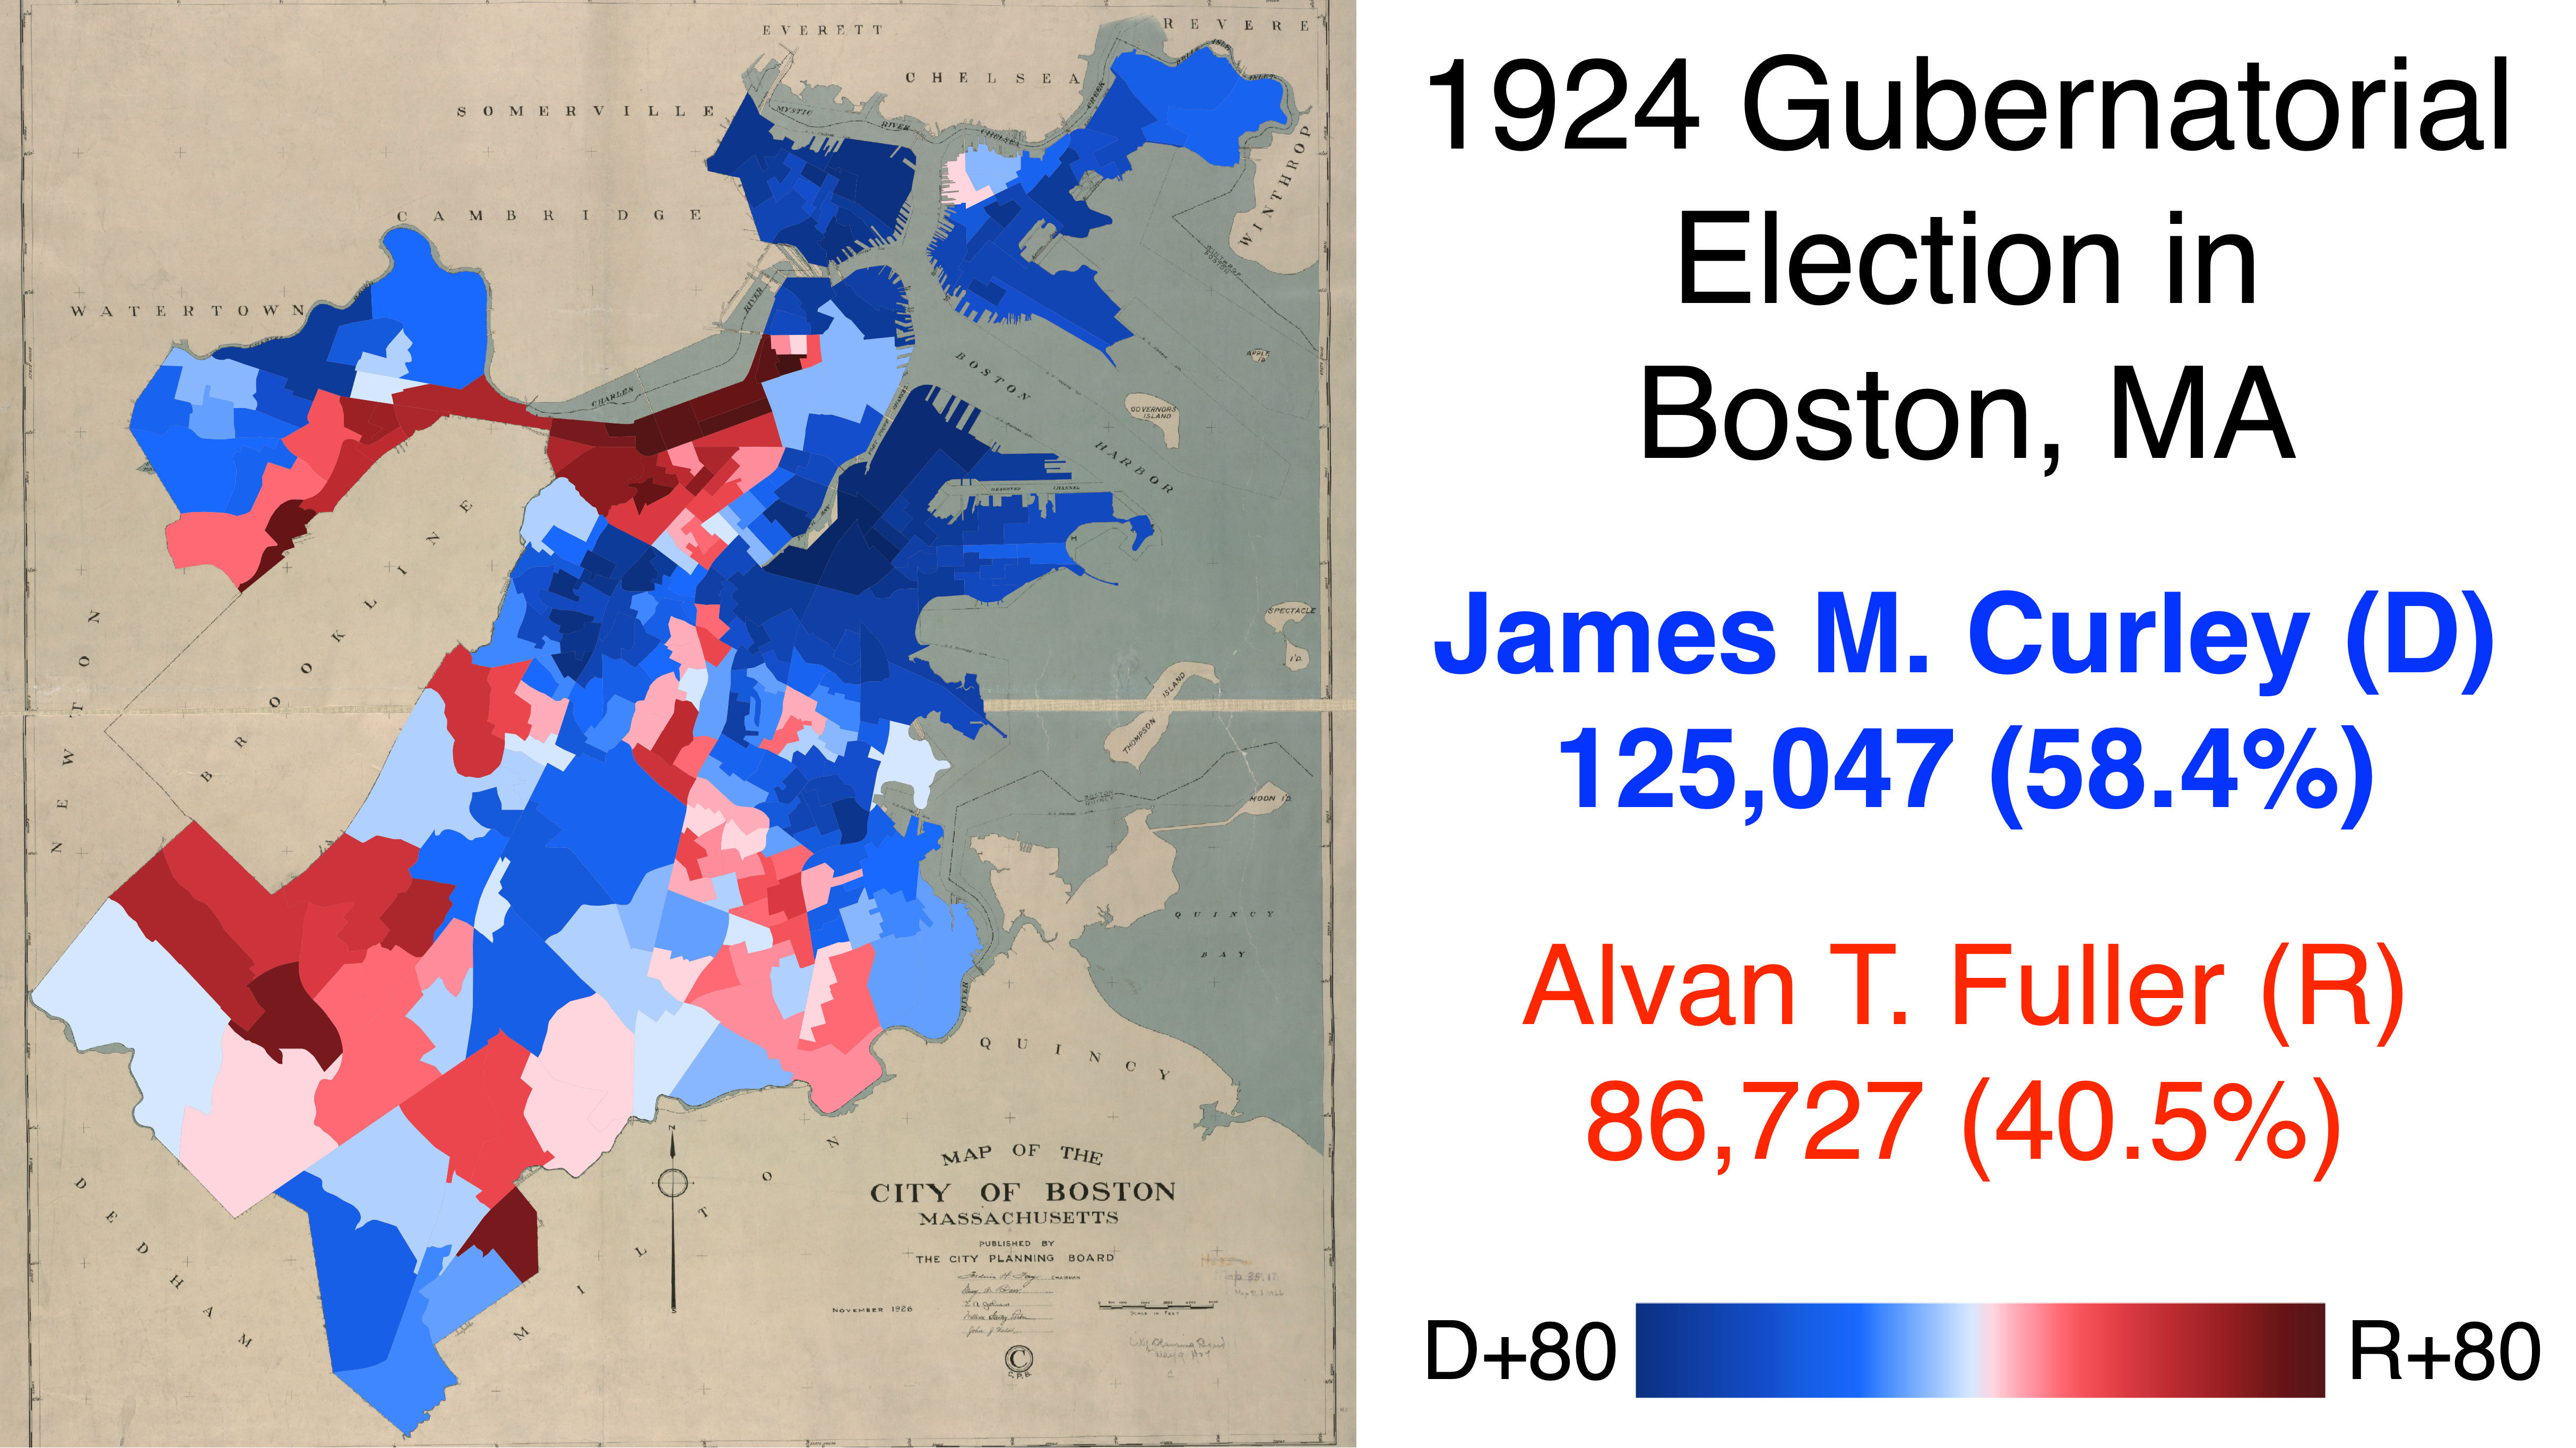
Calvin Coolidge is the most recent Republican presidential candidate to win Boston. In 1924, Boston Democrats fervently backed New York Governor Al Smith, of Irish and Italian heritage, at the Democratic convention, but it deadlocked and chose conservative West Virginian John W. Davis instead.
By this time, Boston had become a reliably Democratic city. Its immigrant communities — first Irish, now Italians and Jews — were still growing quickly, while native-born Yankees had become a minority. In the gubernatorial race, James Michael Curley won Boston by 18 points despite losing comfortably statewide:
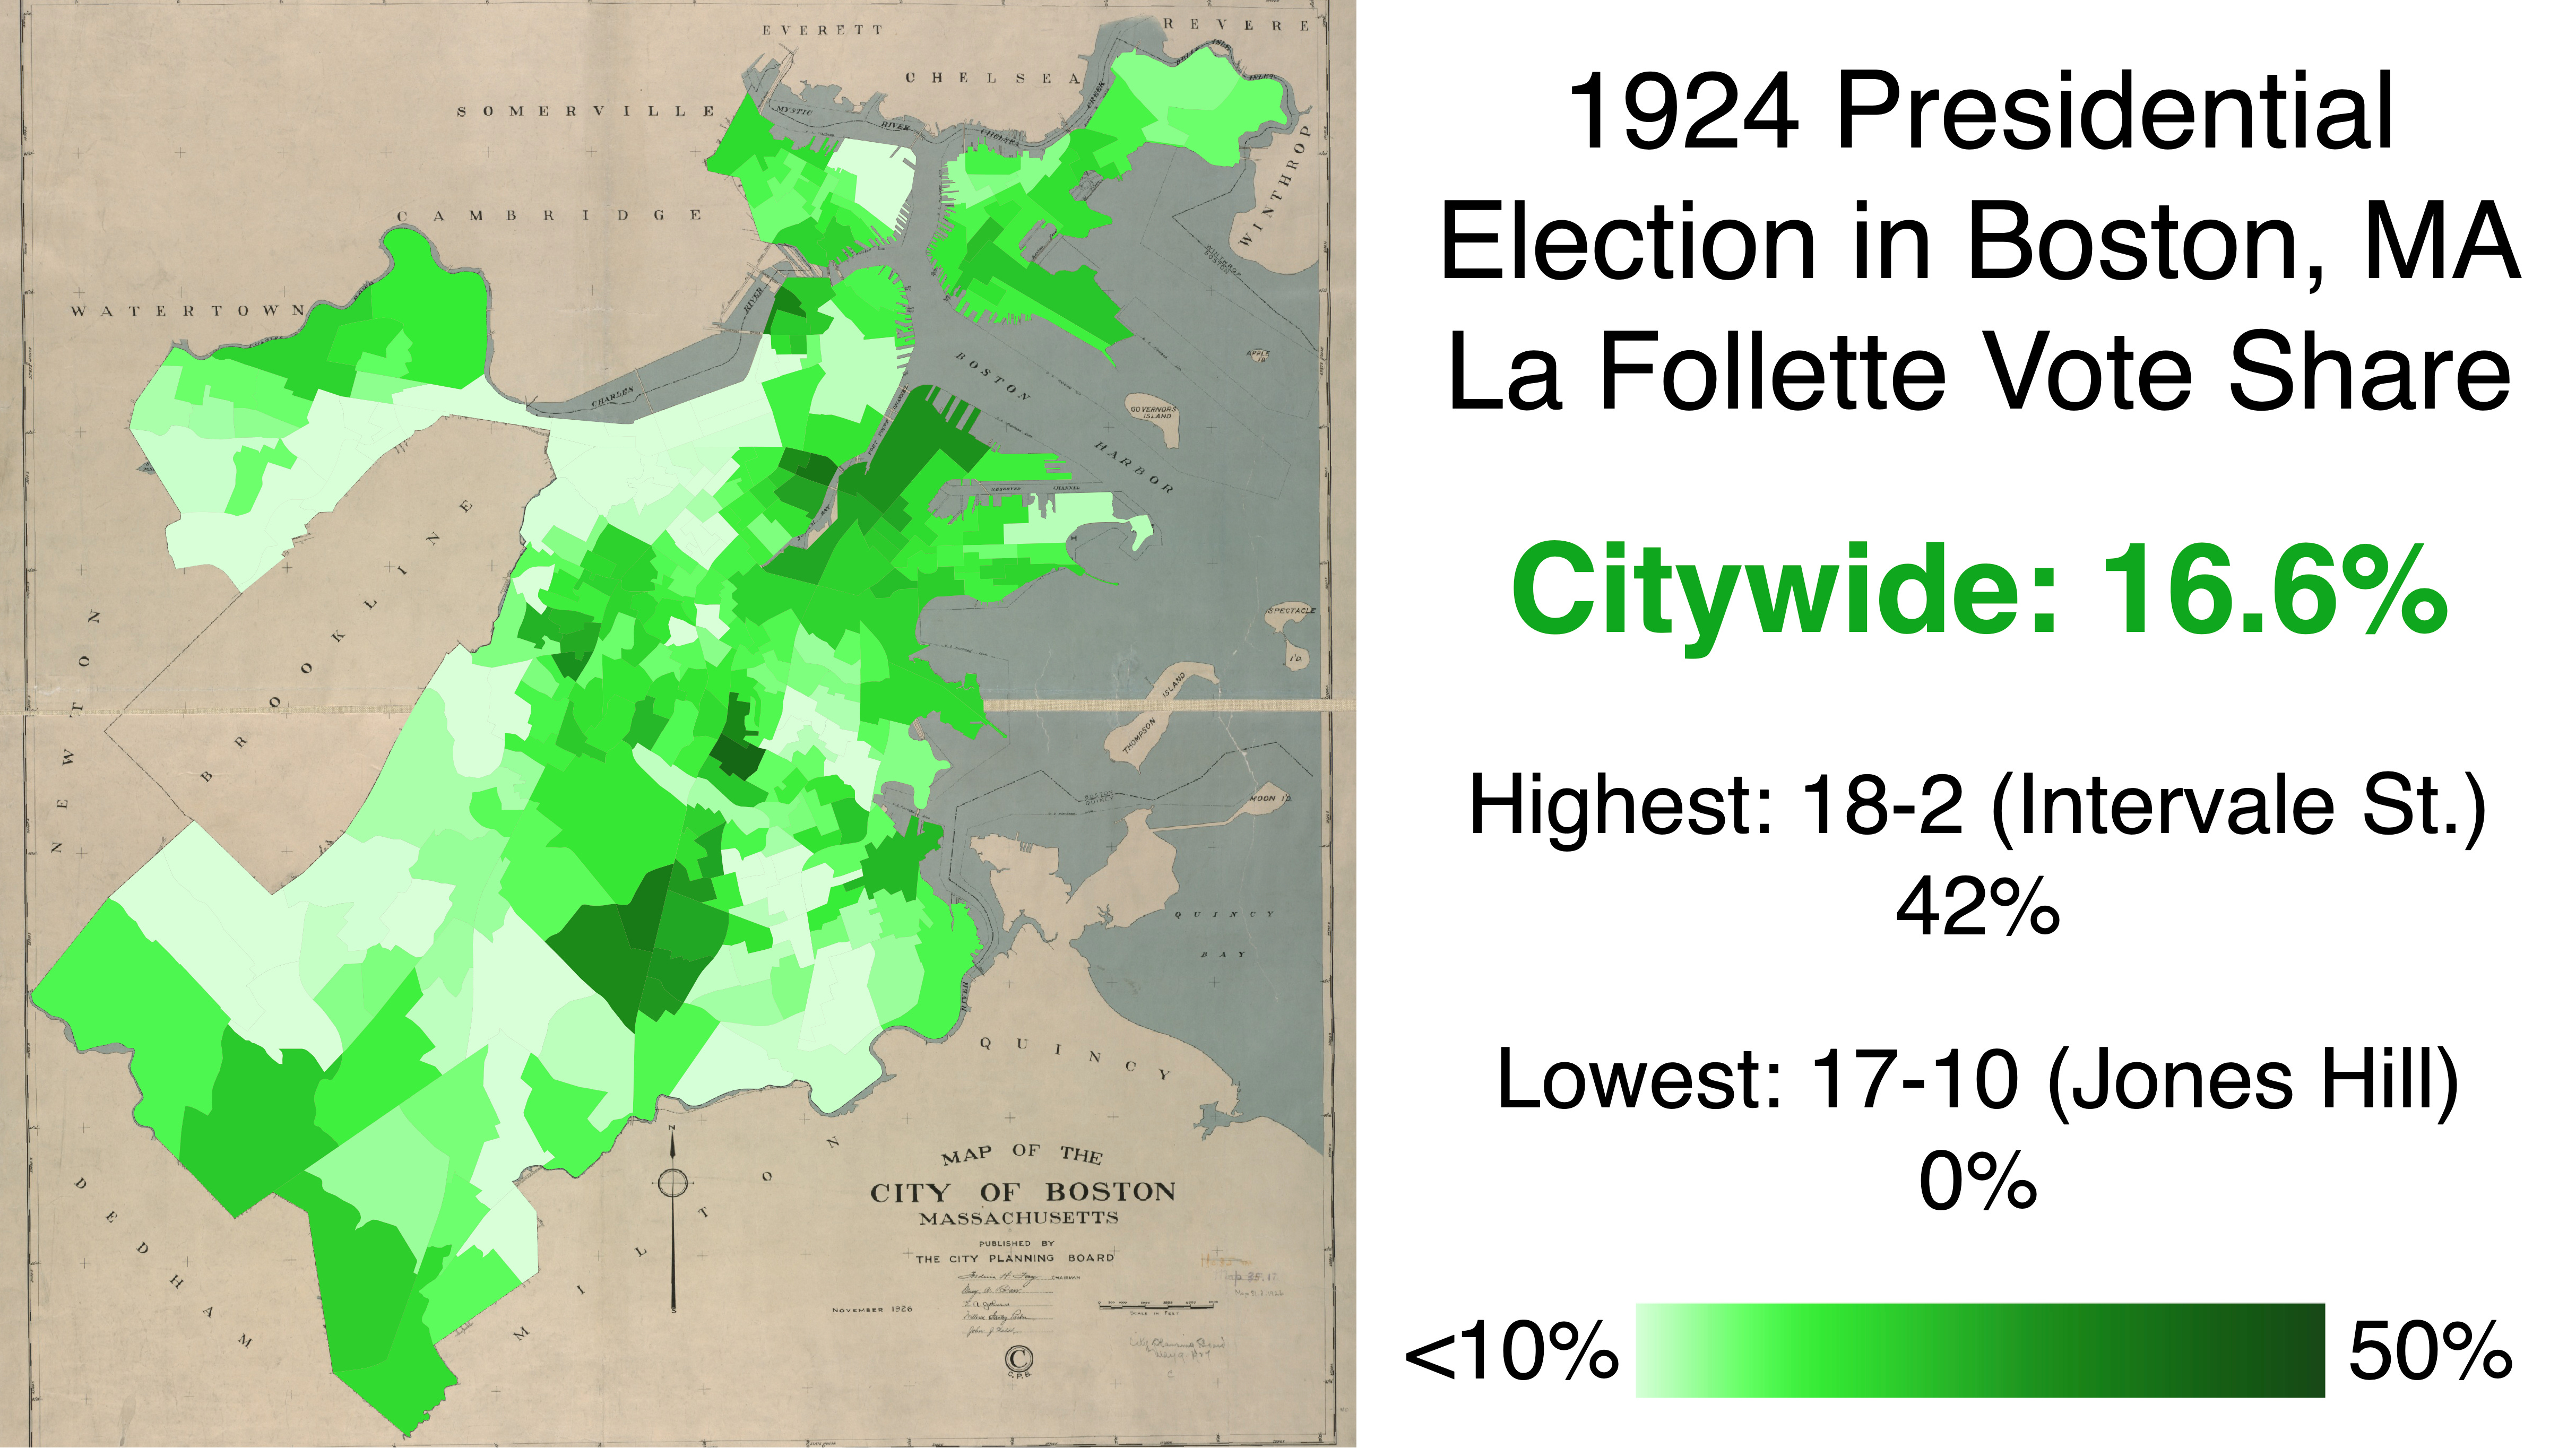
However, the disappointment of Smith's convention loss and the candidacy of Progressive Robert La Follette severely weakened Davis in Boston. La Follette's strongest precincts were in areas with high concentrations of working-class immigrants like Fort Hill and South Boston:
Davis not only lost votes to La Follette but also suffered from dampened turnout. Across the city, but particularly in Democratic strongholds, the governor's race attracted more voters than the presidential. These factors combined to produce paltry margins for Davis in places where Democrats normally scored landslides.
Boston becomes a Democratic bastion
1928 is an inflection point in Boston’s political history. Al Smith won the Democratic nomination, becoming the first-ever Catholic candidate for president, supercharging Irish and Italian enthusiasm and producing an unprecedented Democratic landslide in the Hub even as he was trounced nationwide. Since this election, no Republican has carried the city.
Smith blew past Woodrow Wilson's 58.8% in 1916 to set a new best Democratic performance for president. He also exceeded every previous candidate for governor — impressive, since many were Irish. Boston voted 53 points more Democratic than the nation, a mark not surpassed until 1968. Smith's dominant margins in ethnic areas like Charlestown and East Boston dwarfed those of vaunted local icon James Michael Curley, who’d run for governor four years prior. Yet Smith's improvements weren't confined to Catholic enclaves; indeed he outran Curley all across the city!
Although Curley was popular among the Irish, he still ran behind Democratic House candidates in Irish areas, as was typical. However, Smith bucked this trend, despite House candidates doing better in 1928 than 1924!
These maps were my most arduous undertaking to date, requiring me to hand-draw 339 precincts. Despite this election’s significance, I’m almost certain Smith’s victory in Boston had never previously been visualized at such a granular level.
Al Smith’s win visualized by congressional district
I also mapped this election at the district level, doing some QGIS work to create the shapefile. The Cape district is reddest here, despite Hoover’s best towns being located mostly in very rural Western Massachusetts - that area was interspersed with enough mill cities to neutralize those small agricultural hamlets.
Modern election maps
An introduction to modern voting trends
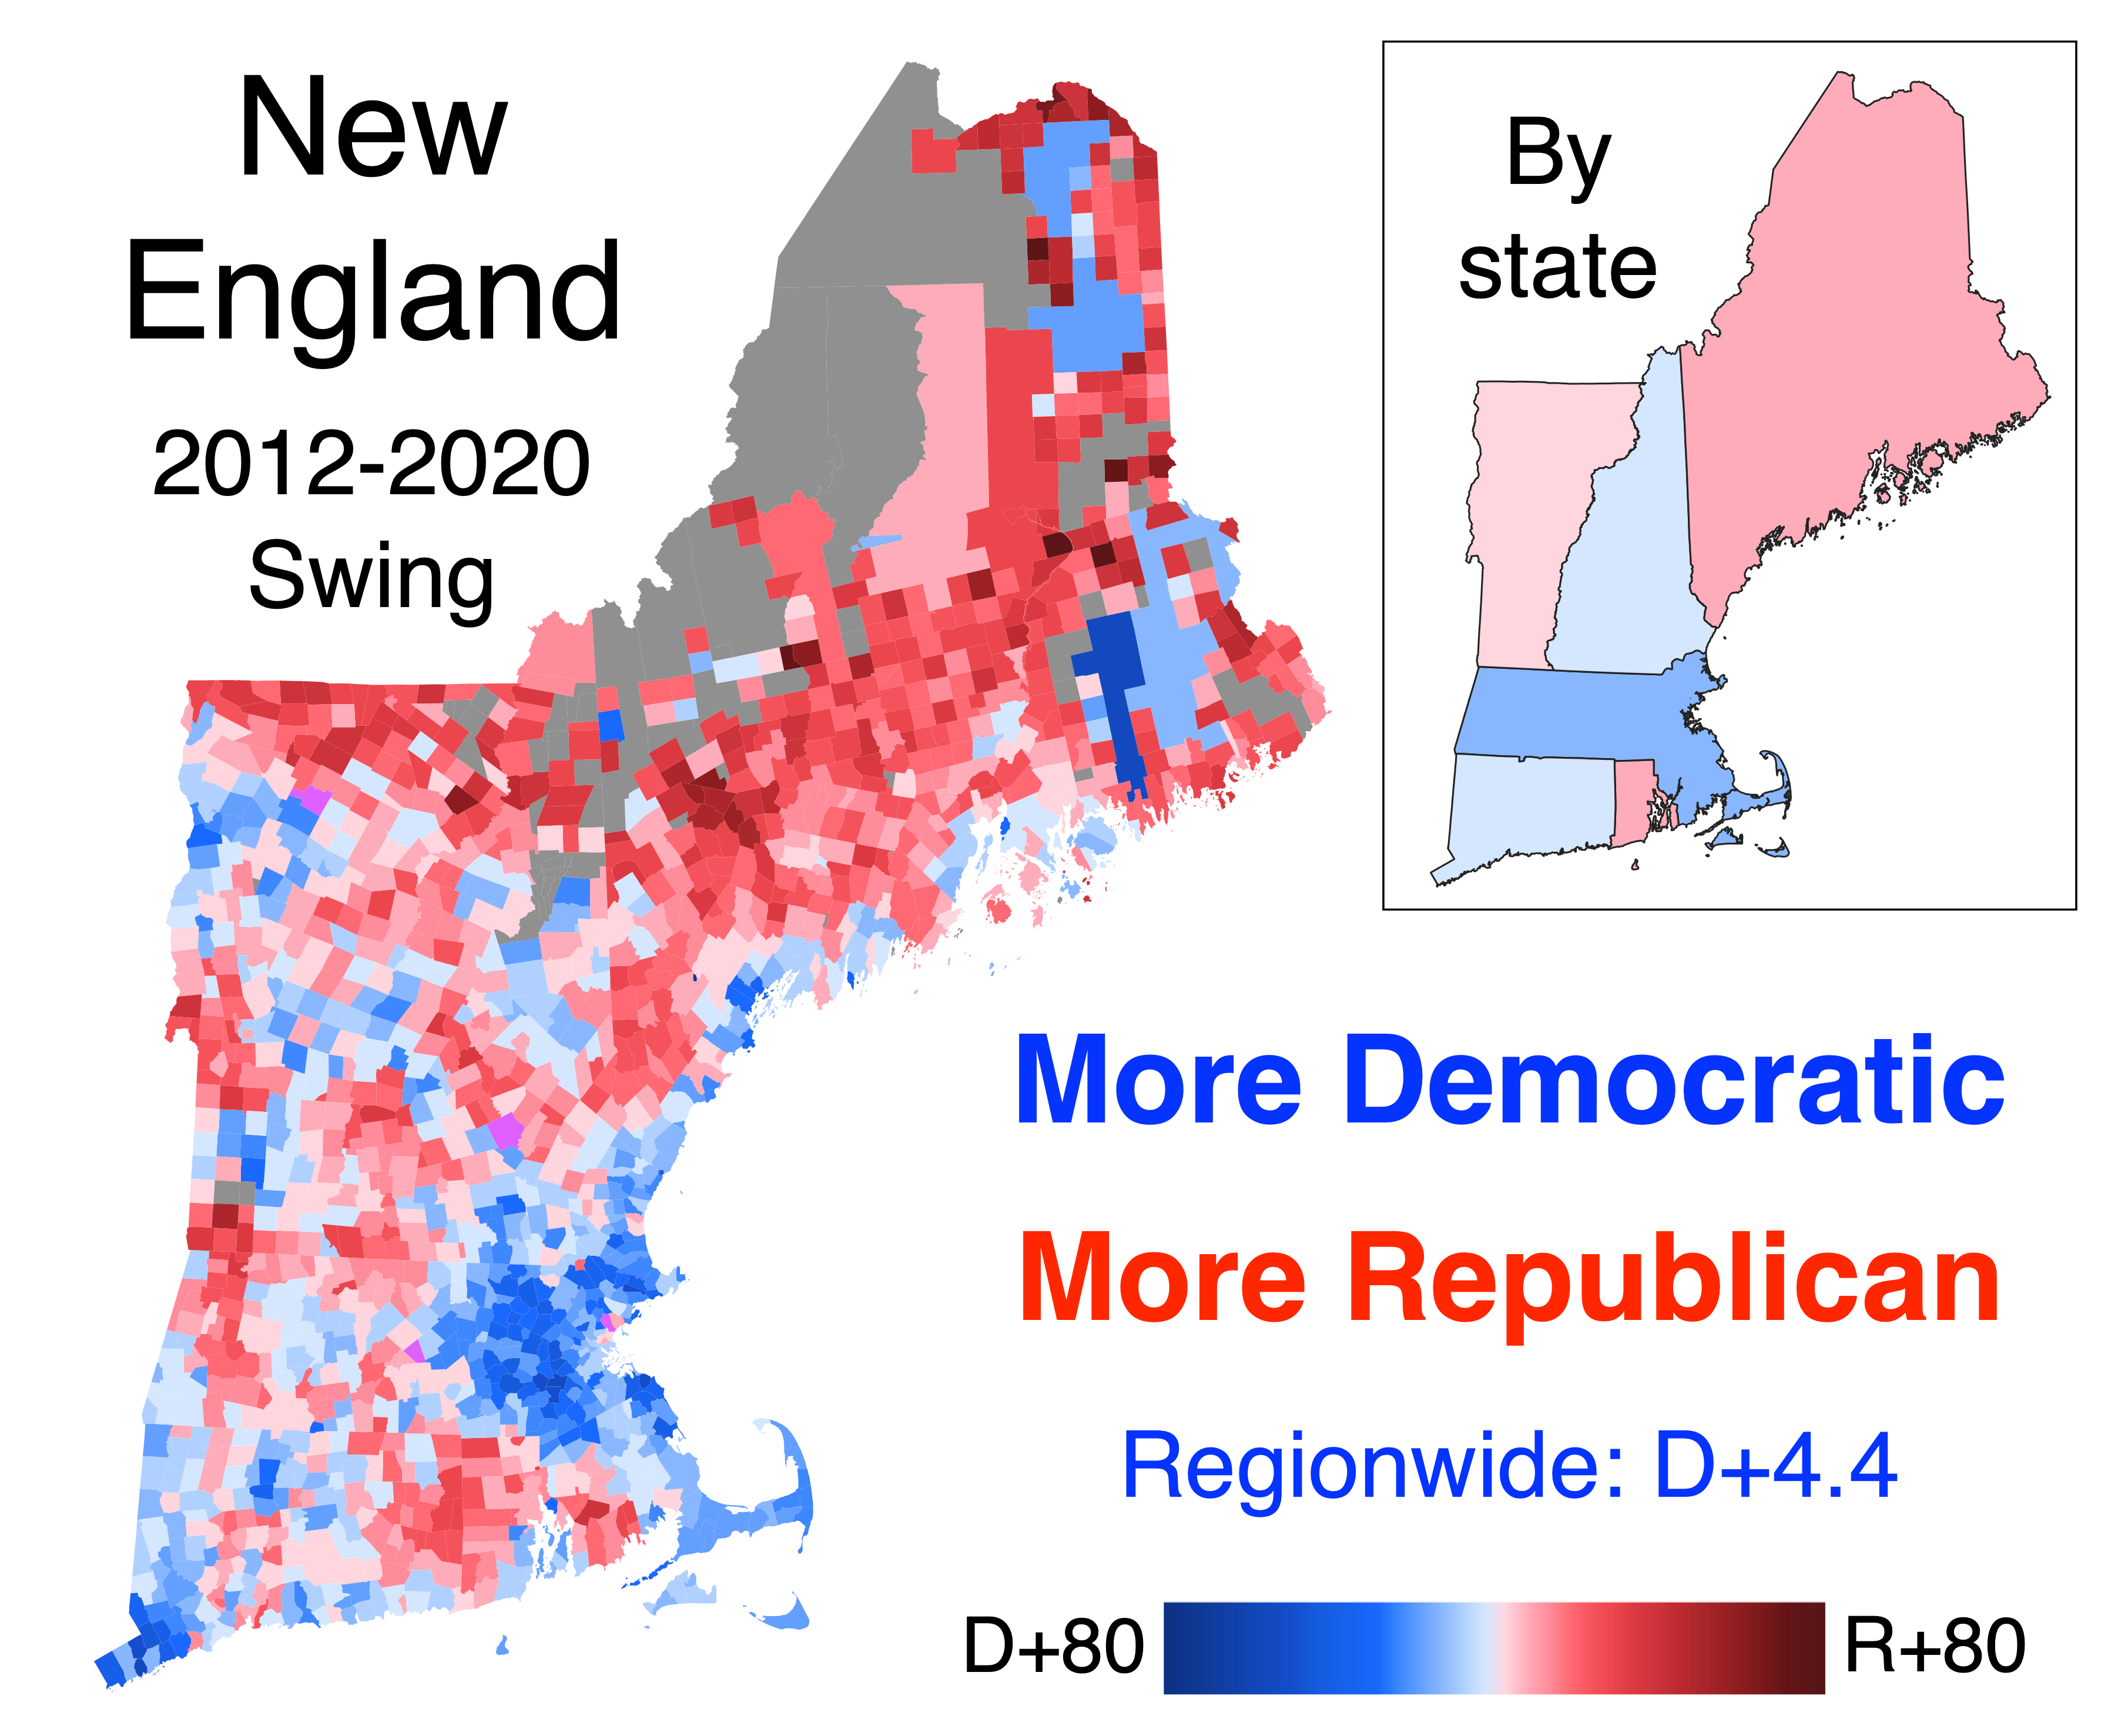
Earlier this year, I did the grunt work necessary to get all the New England states’ data into one spreadsheet, and it paid off. This is frequently the first thing I show people who are new to election maps; it’s an easy introduction to a fundamental trend in modern elections — education polarization, meaning that places with lots of degree holders are increasingly favoring Democrats, and vice versa — through a New England lens. Those familiar with the region can mentally connect the bougie nature of towns west of Boston or along the southern Maine coast with this trend, as they can the gritty South Coast of Massachusetts and former paper milling towns in northern New Hampshire and Maine.
How Massachusetts voted in 2020
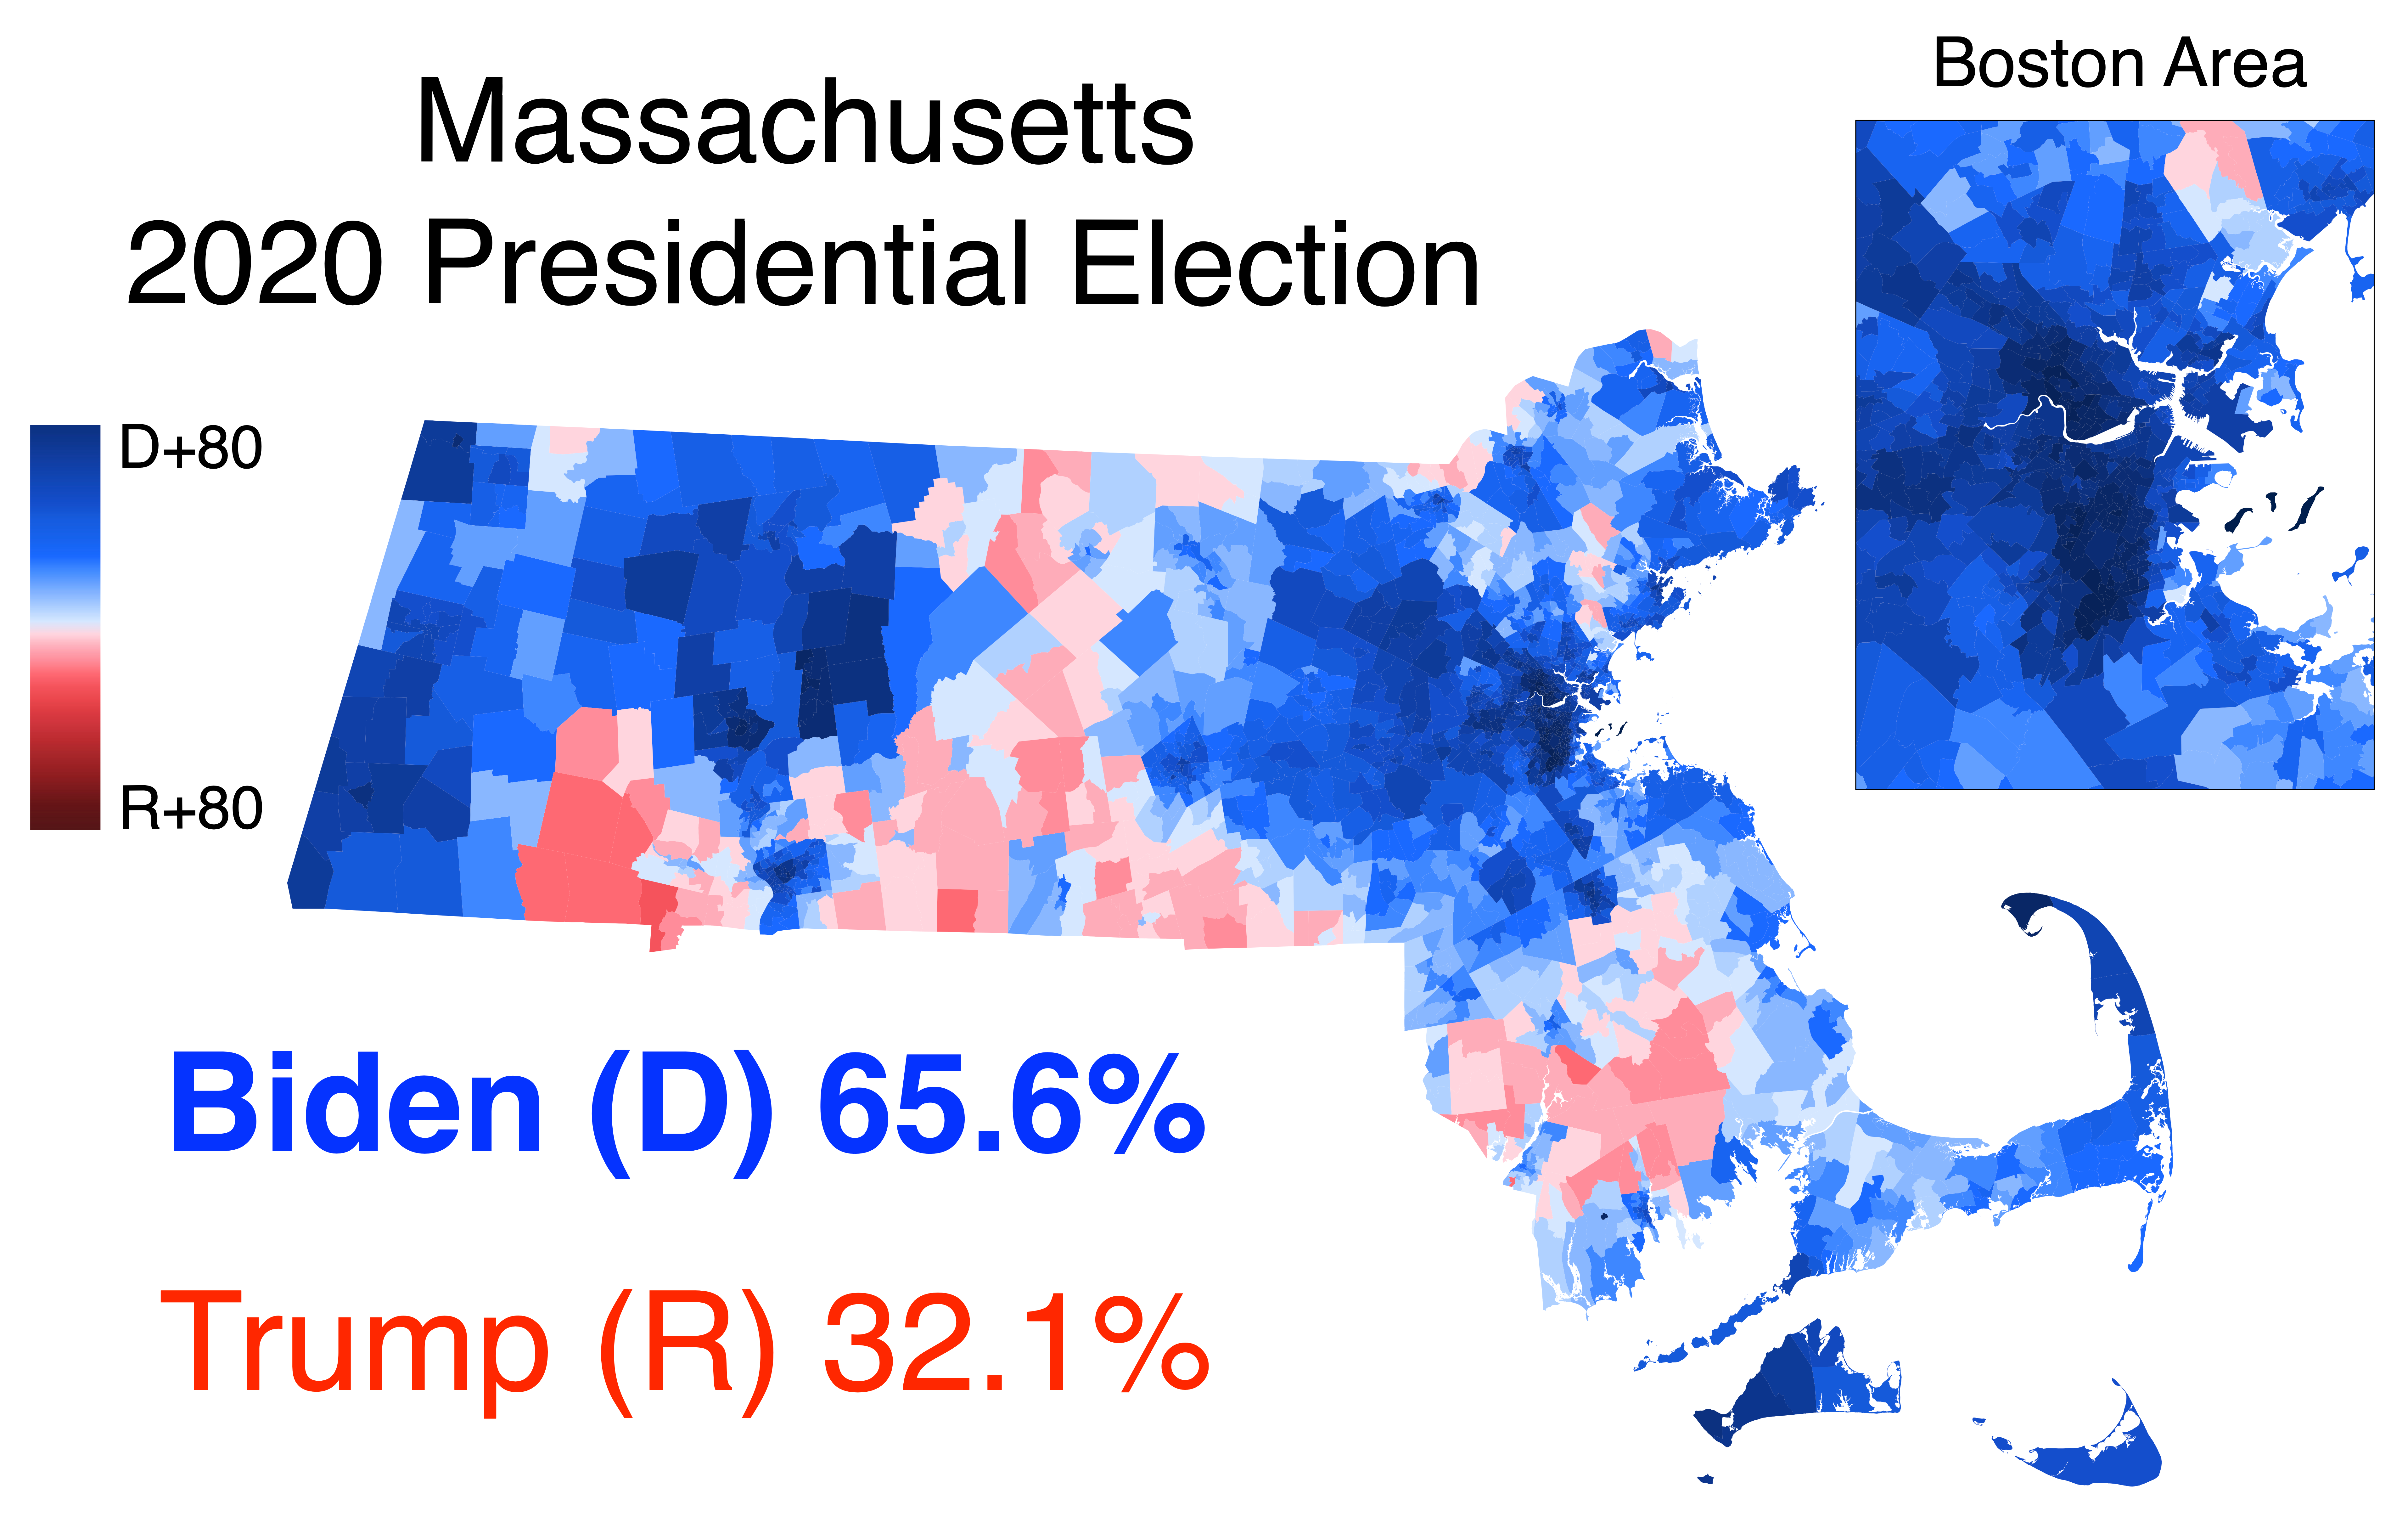
I figured it’d only be appropriate to include a map of the most recent presidential election — always good to have as a reference.
Ross Perot falls flat in Boston
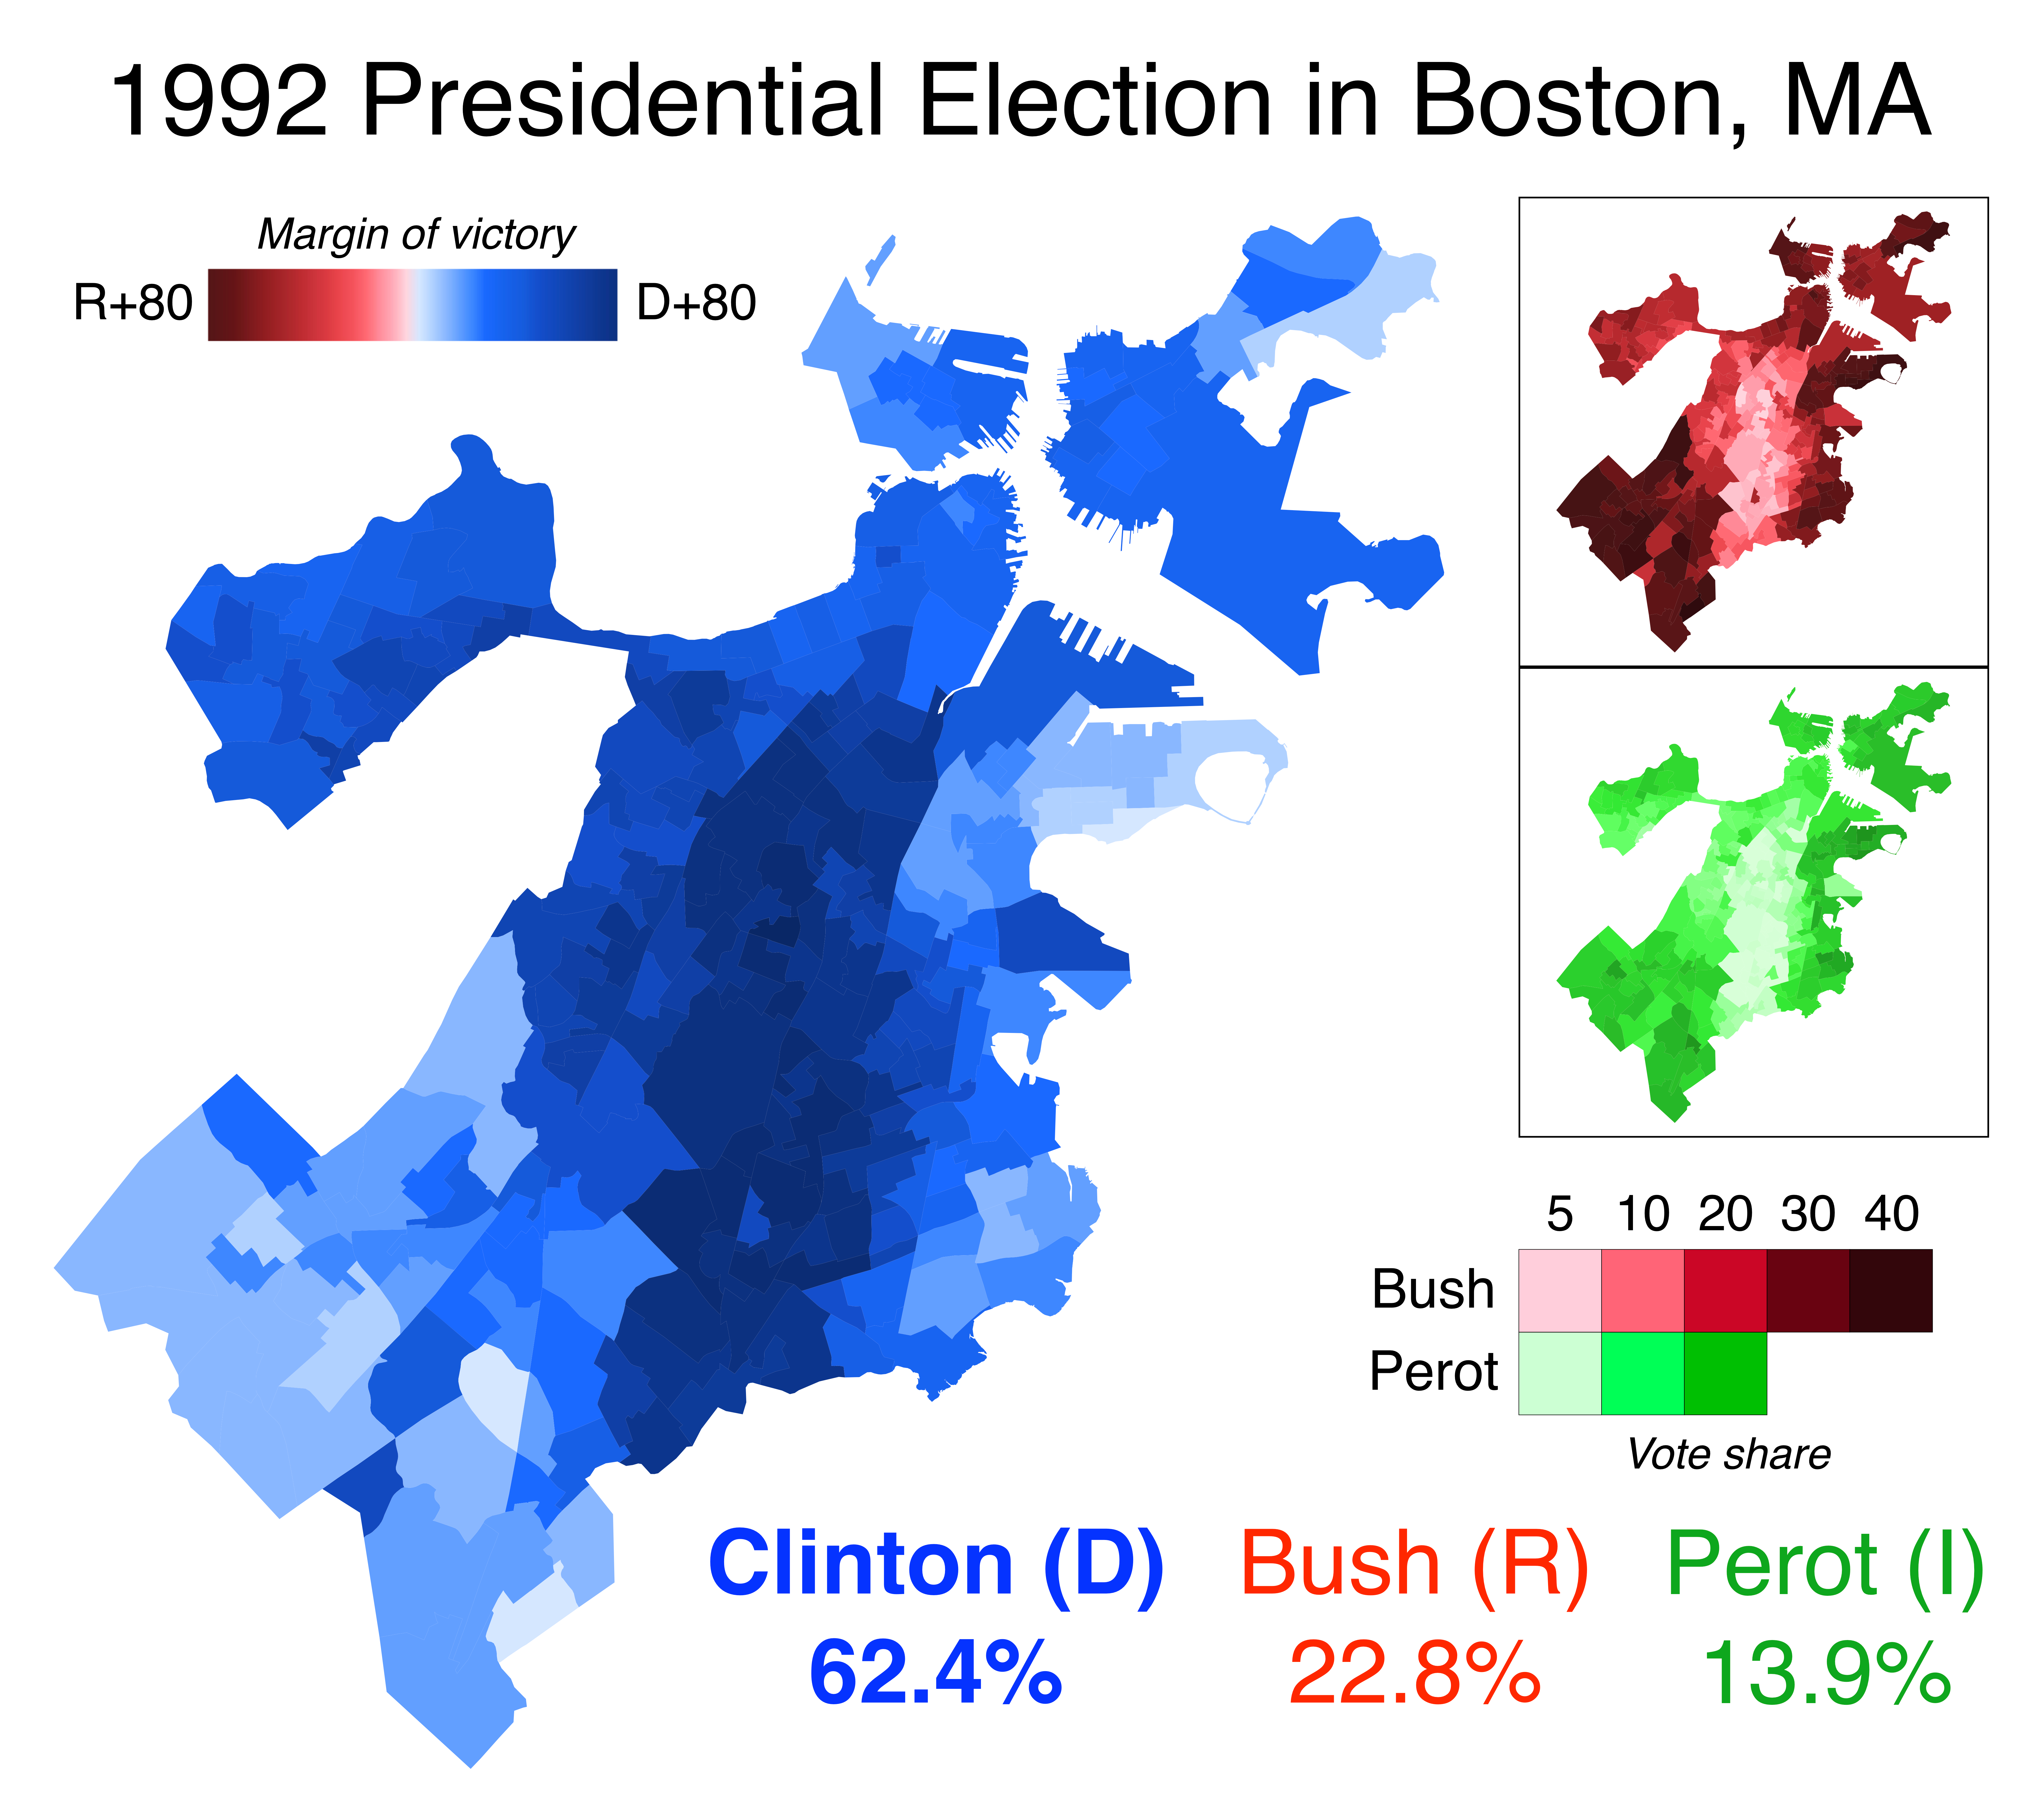
From a trends perspective, this election wasn’t particularly interesting. Unlike other parts of the country, Ross Perot lacked a distinctive base in Boston — he did 15-20 points worse than Bush almost everywhere. But I enjoyed the layout I made for this one!
The best-performing candidates since 2000 in Southern New England
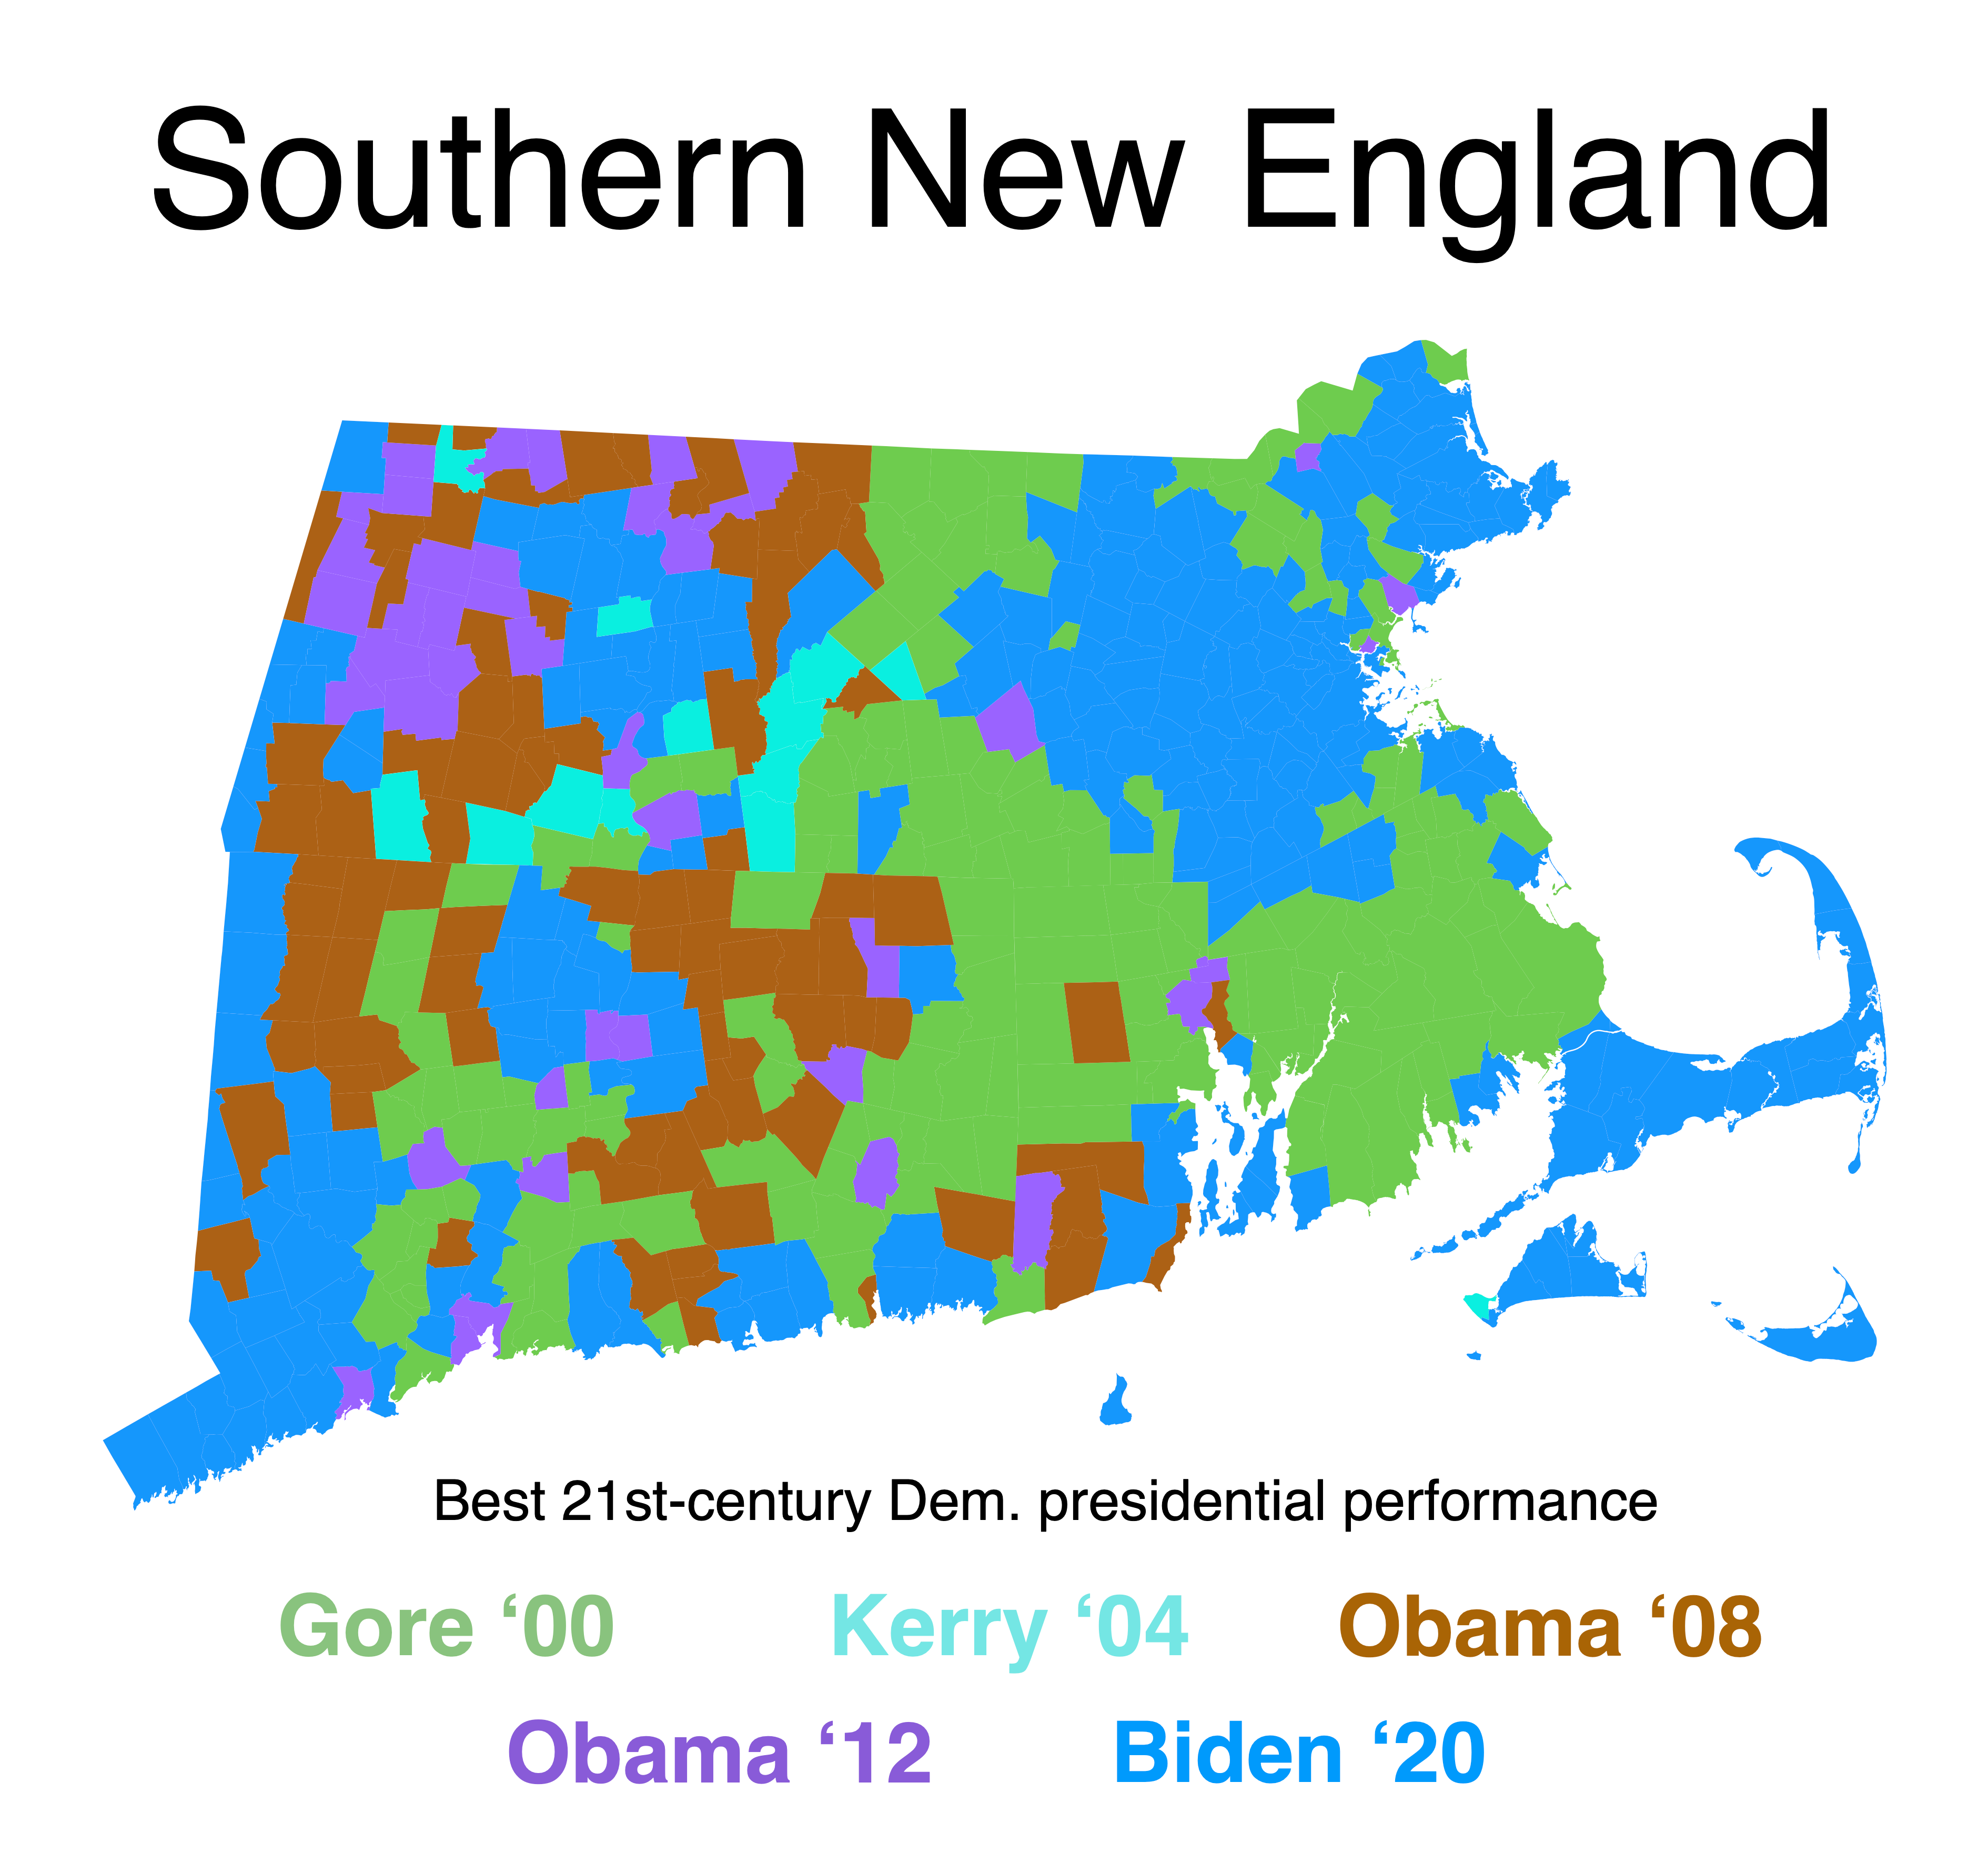
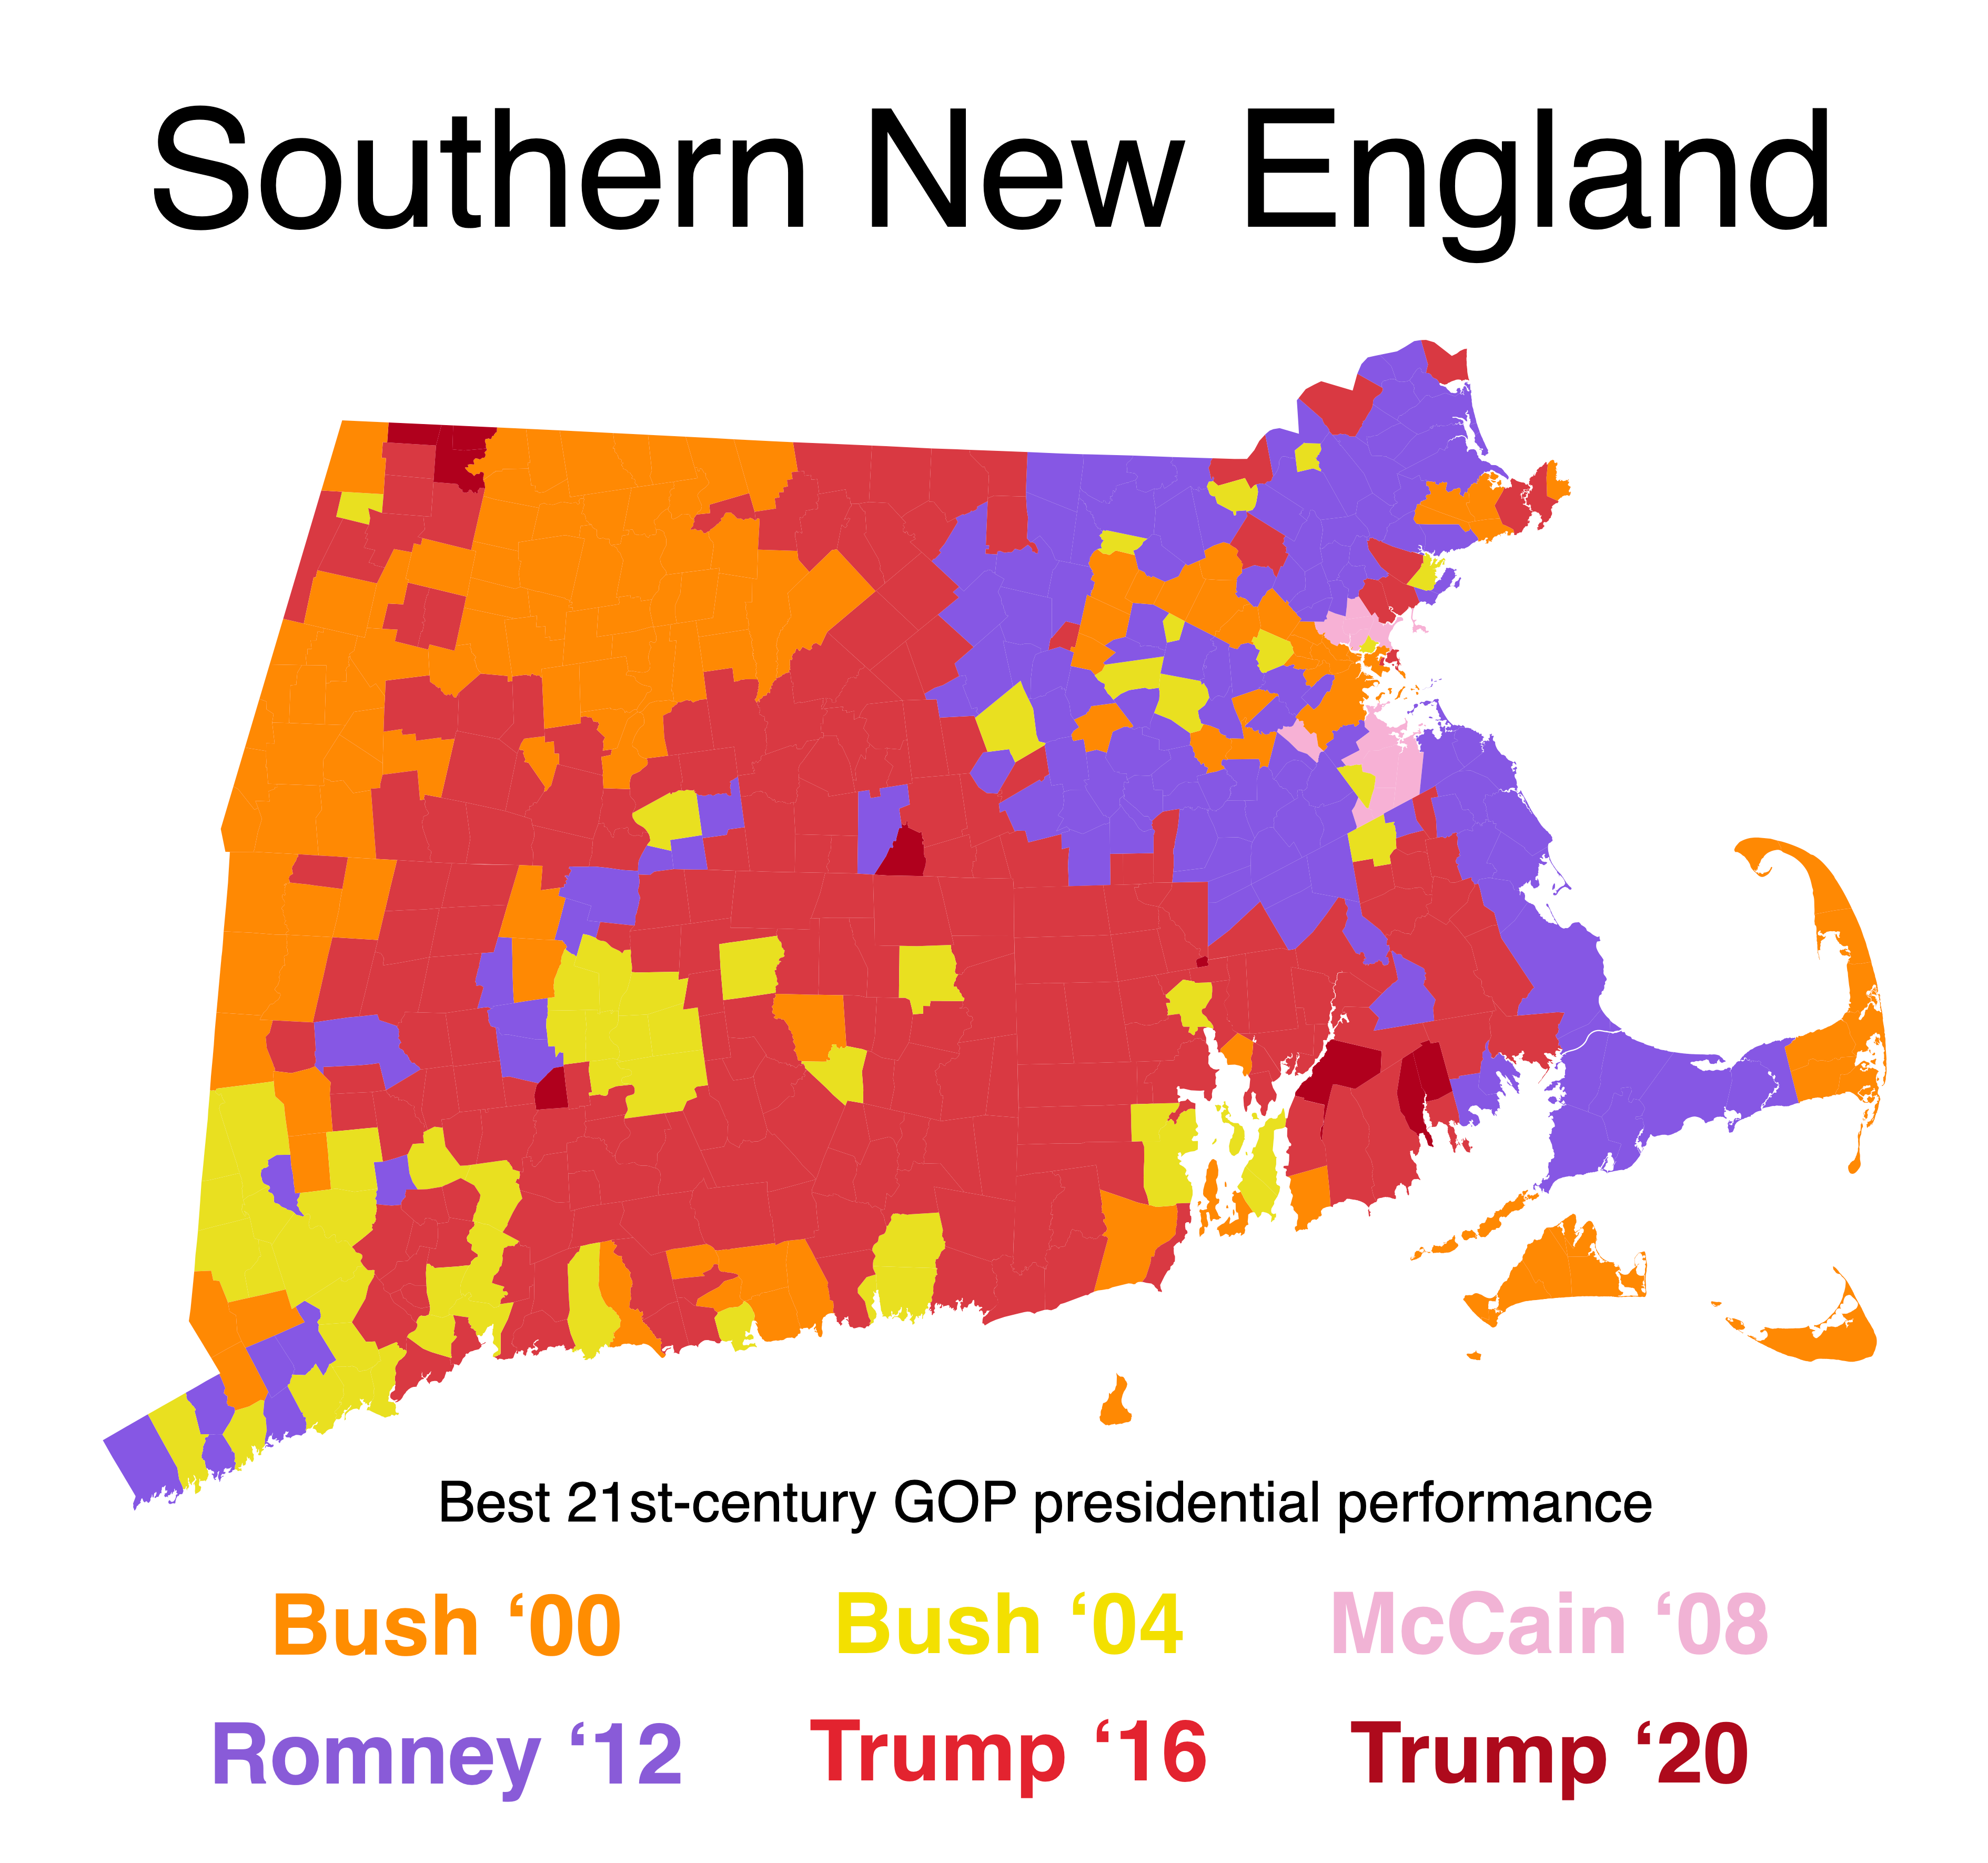
These maps are helpful for orienting yourself to modern trends in Southern New England.
Across much of the region, Trump made anomalous inroads in 2016, setting a high-water mark for modern Republicans in most of Connecticut and Rhode Island. Meanwhile, liberal old-money areas (Route 2, Newport, Lower Cape) turned very blue long before Trump. Mitt Romney’s home-state boost in eastern MA is evident as well.
On the Democratic side, Al Gore's showing in white ethnic areas (where he mostly won comfortably) hasn't been equaled. Obama fared comparatively well in non-touristy, sparse towns; Biden, in high-college areas small and large alike.
The mystery of a prominent state line
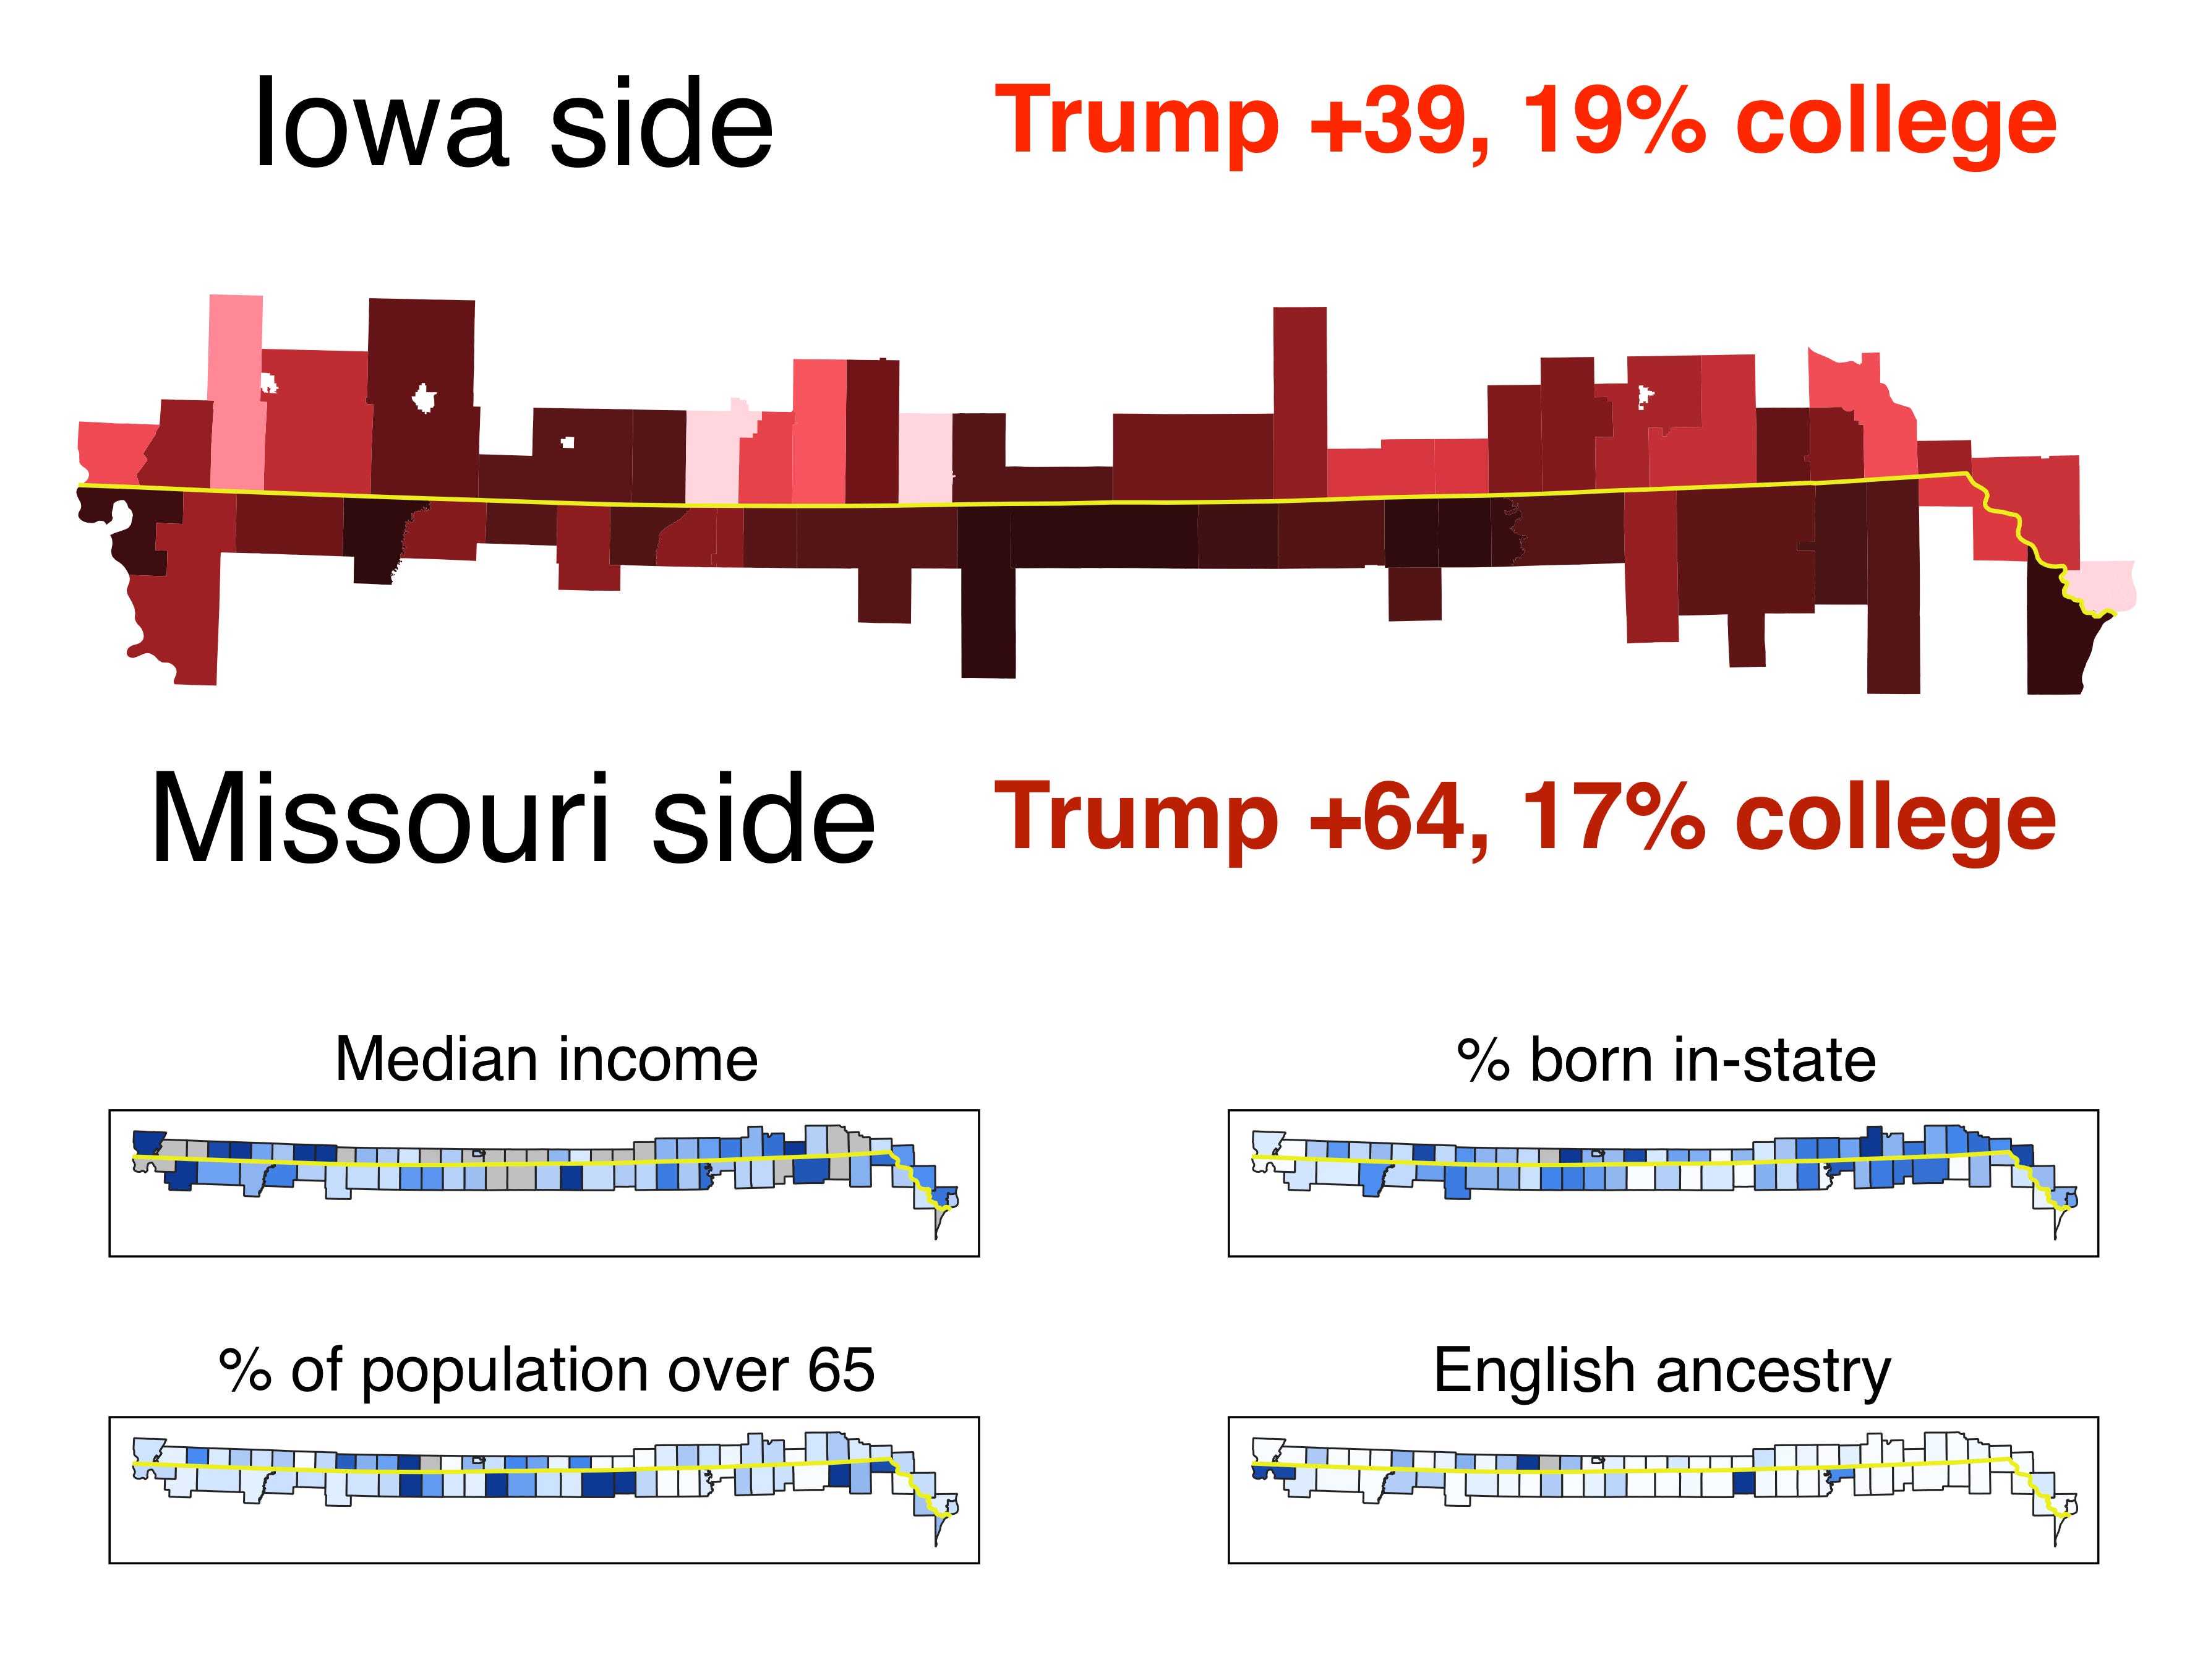
This map set illustrates the curious divergence in voting patterns along the border shared by Iowa and Missouri. While these areas are very similar in terms of age, income, ancestry, and education level, the Missouri side of the border consistently votes more strongly Republican. A helpful reply alerted me to the likely culprit: the Iowa side is mostly Methodist, in contrast to the Missouri side’s Southern Baptism.
The evolution of third-party voting in Southern New England
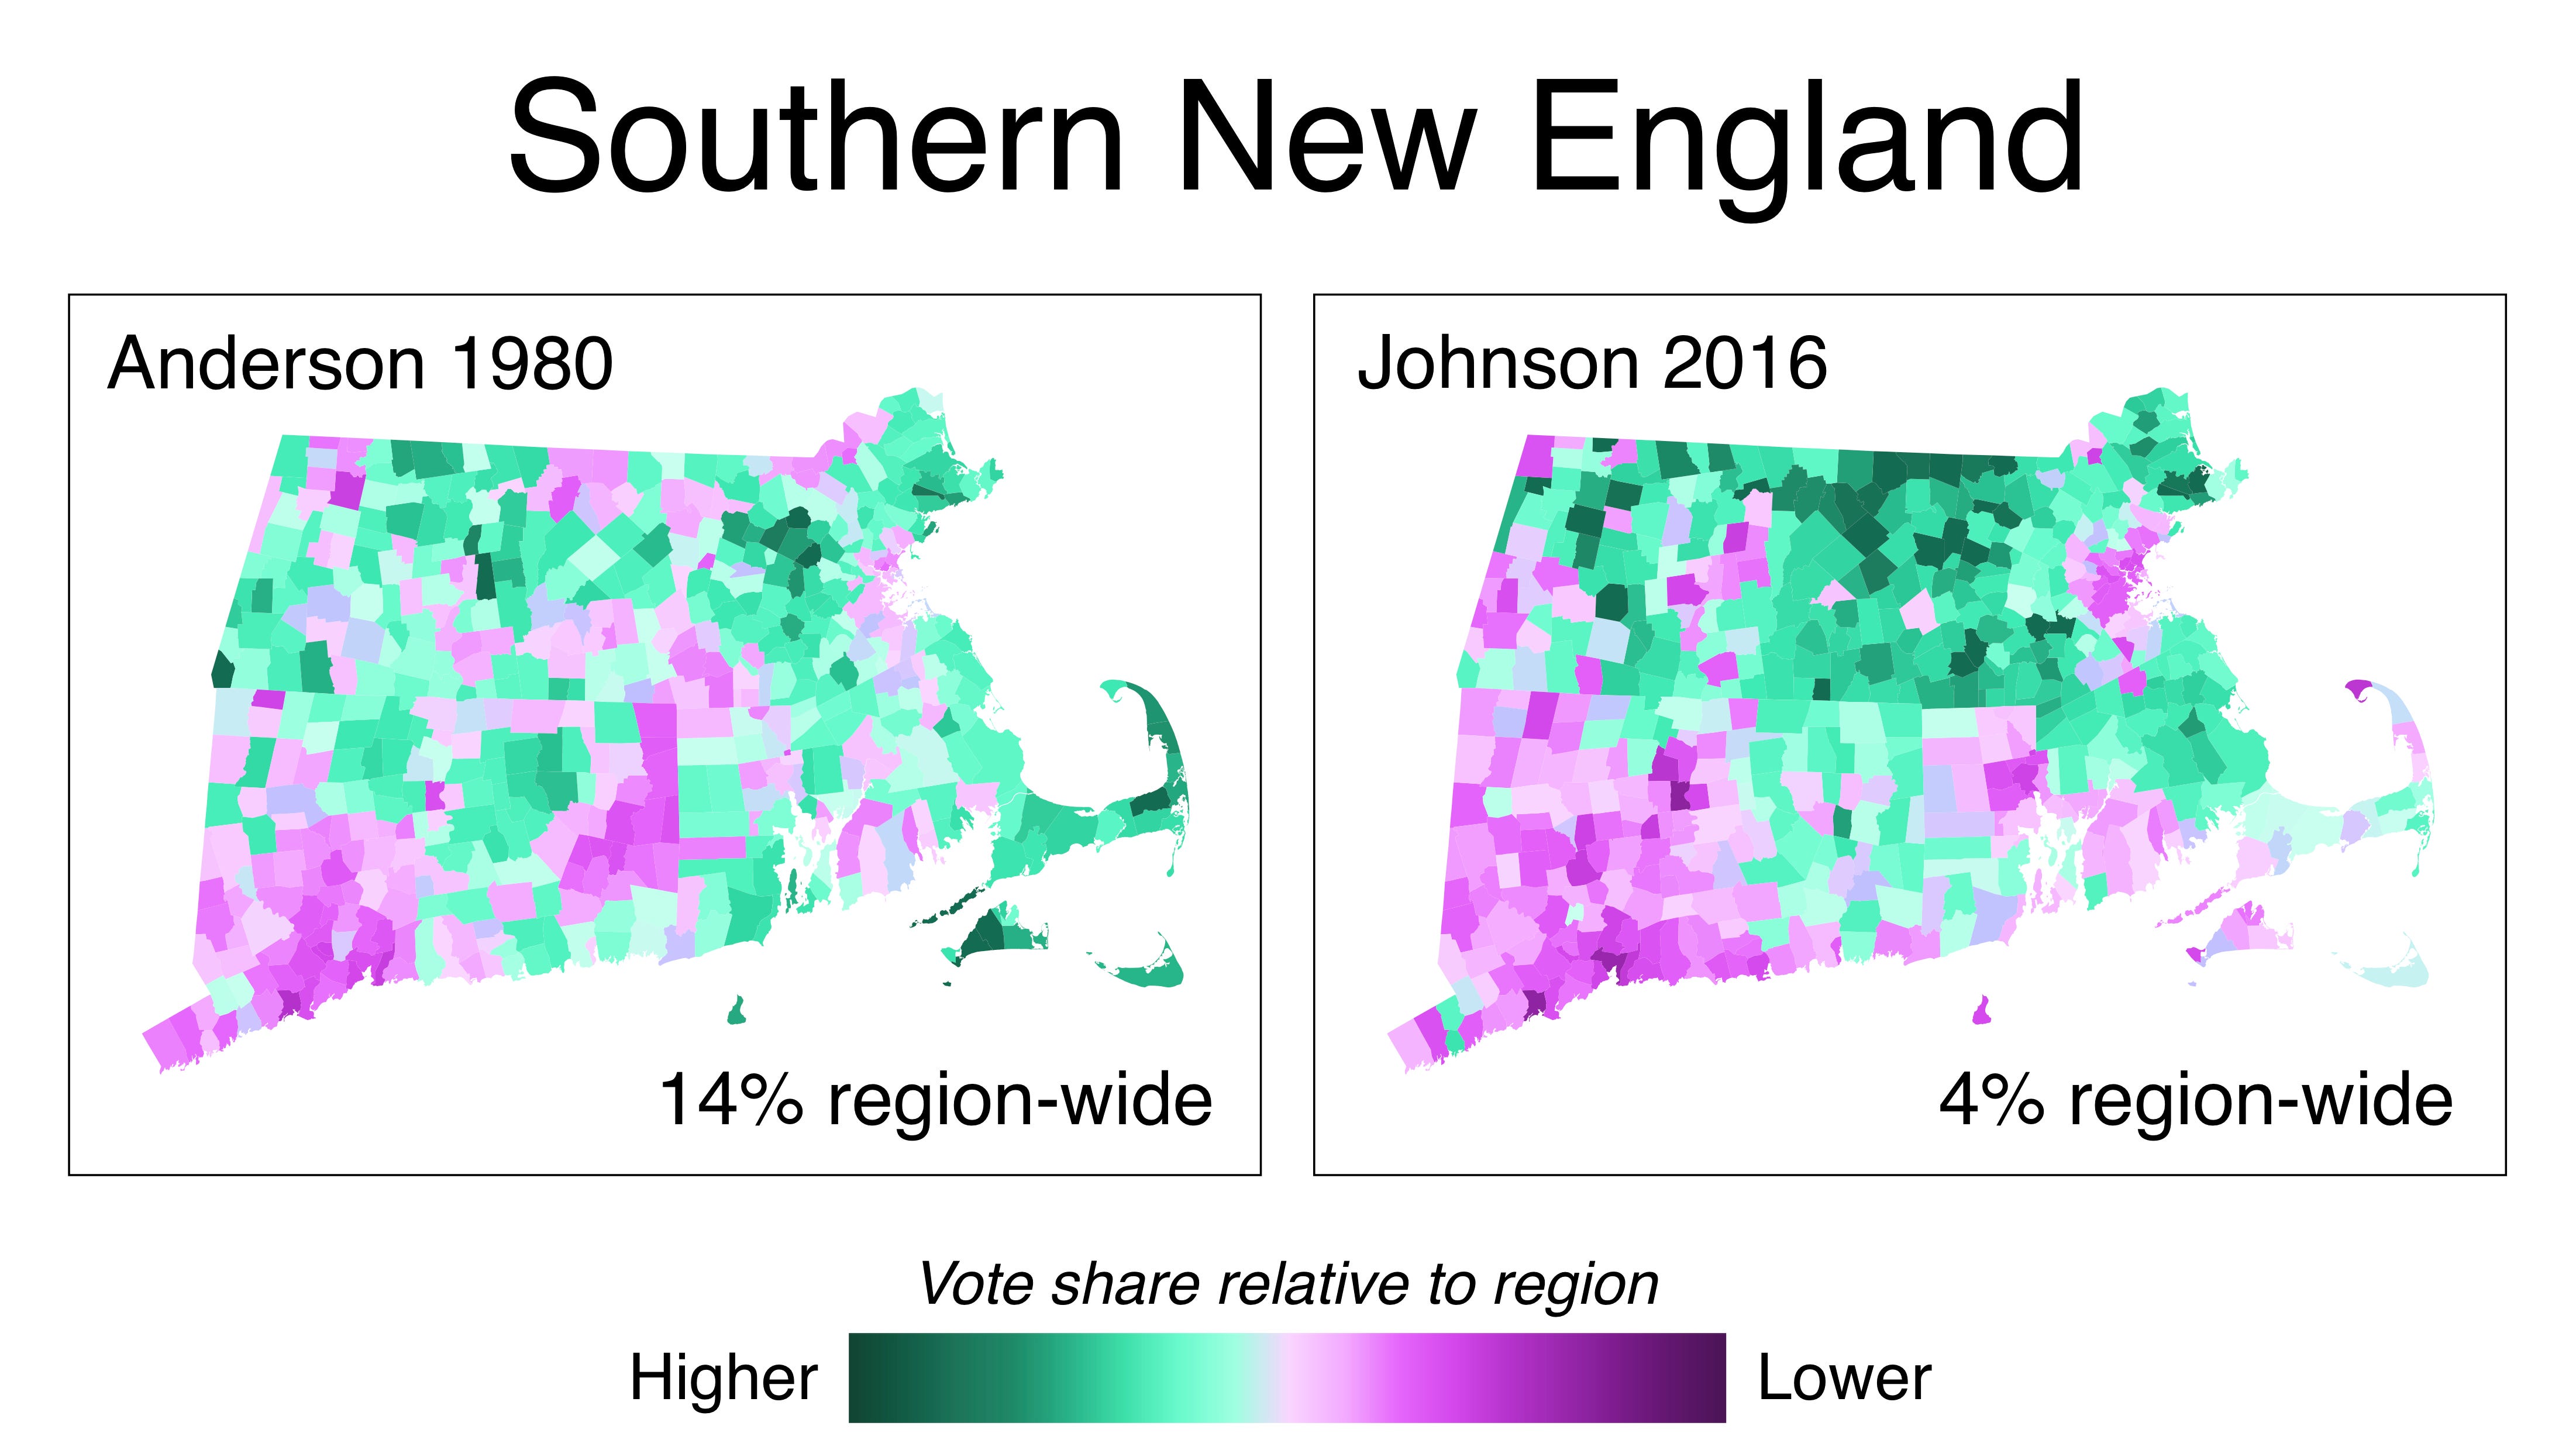
In his independent 1980 presidential campaign, socially liberal Republican John Anderson excelled in Southern New England’s intellectual bastions. His best town in the region was Lincoln (which also produced Trump’s worst showing in Mass. in the 2024 GOP primary). But with Anderson’s strongholds firmly in Democratic hands now, third-party voting patterns have changed. Gary Johnson, the main option for 2016 voters who despised both Hillary Clinton and Trump, tanked in cities, doing best in low-college white areas or super ancestrally Republican towns like Darien, CT and Dover, MA.
Realignment in the Upper Midwest
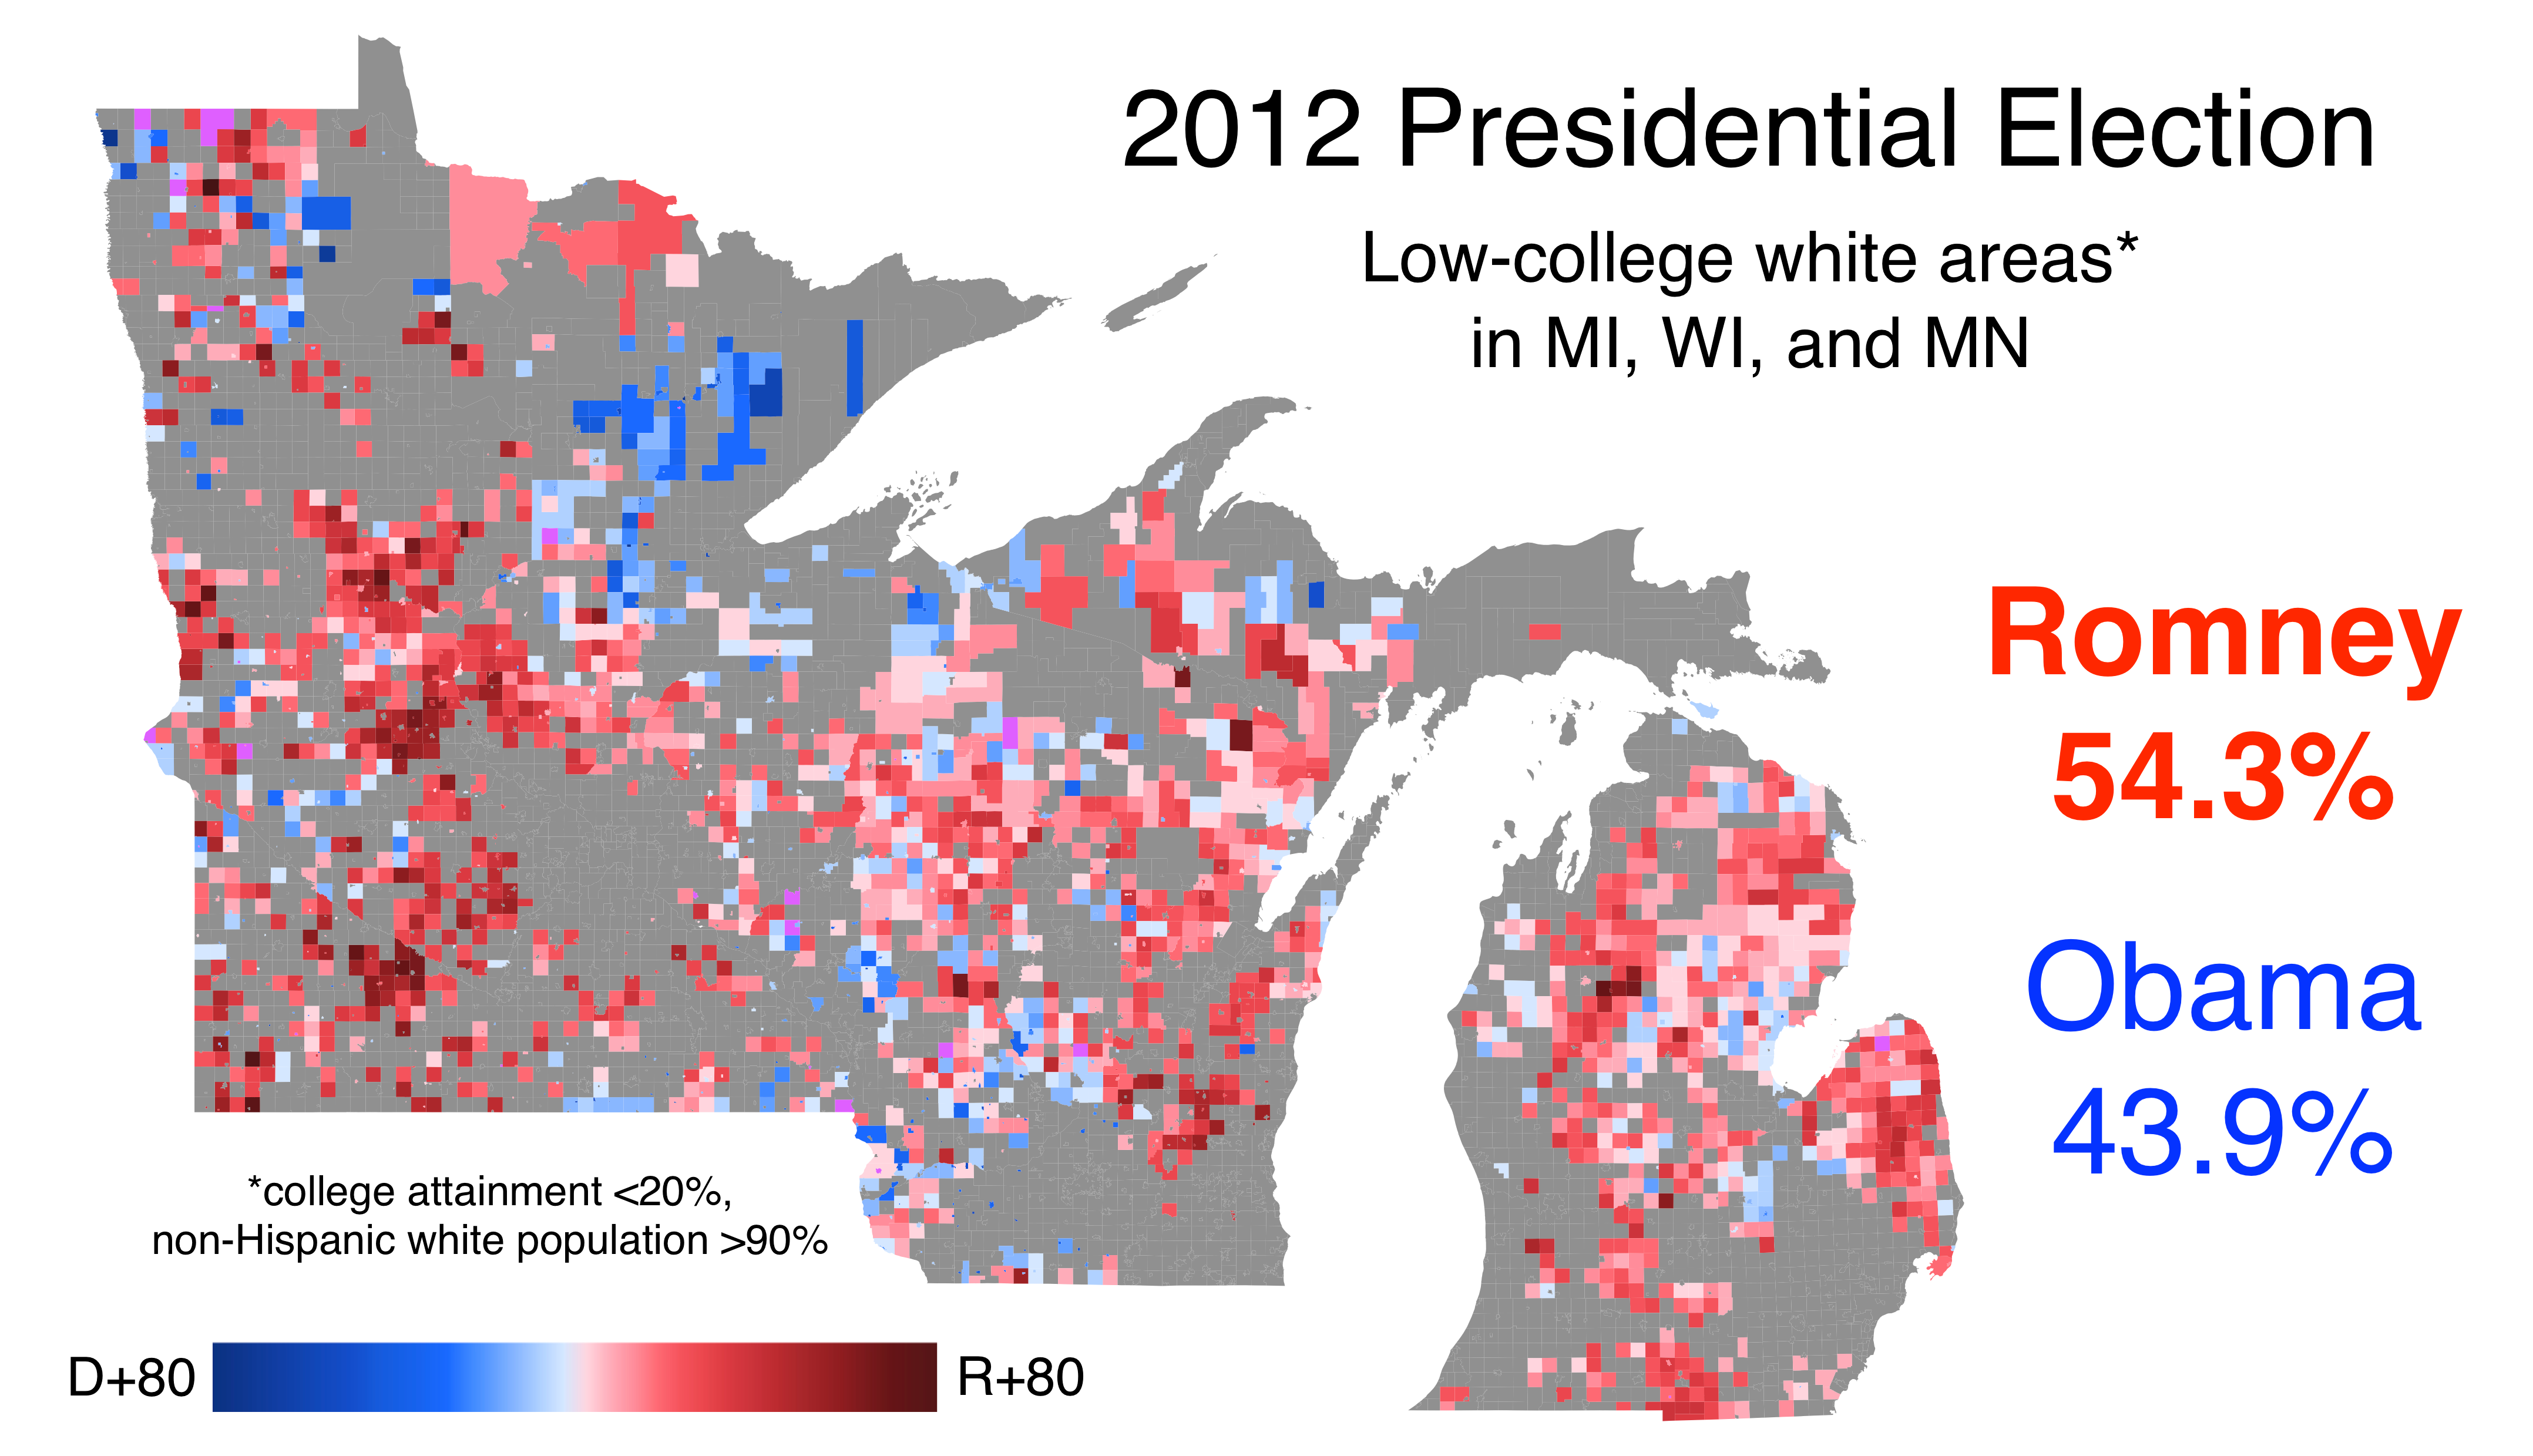
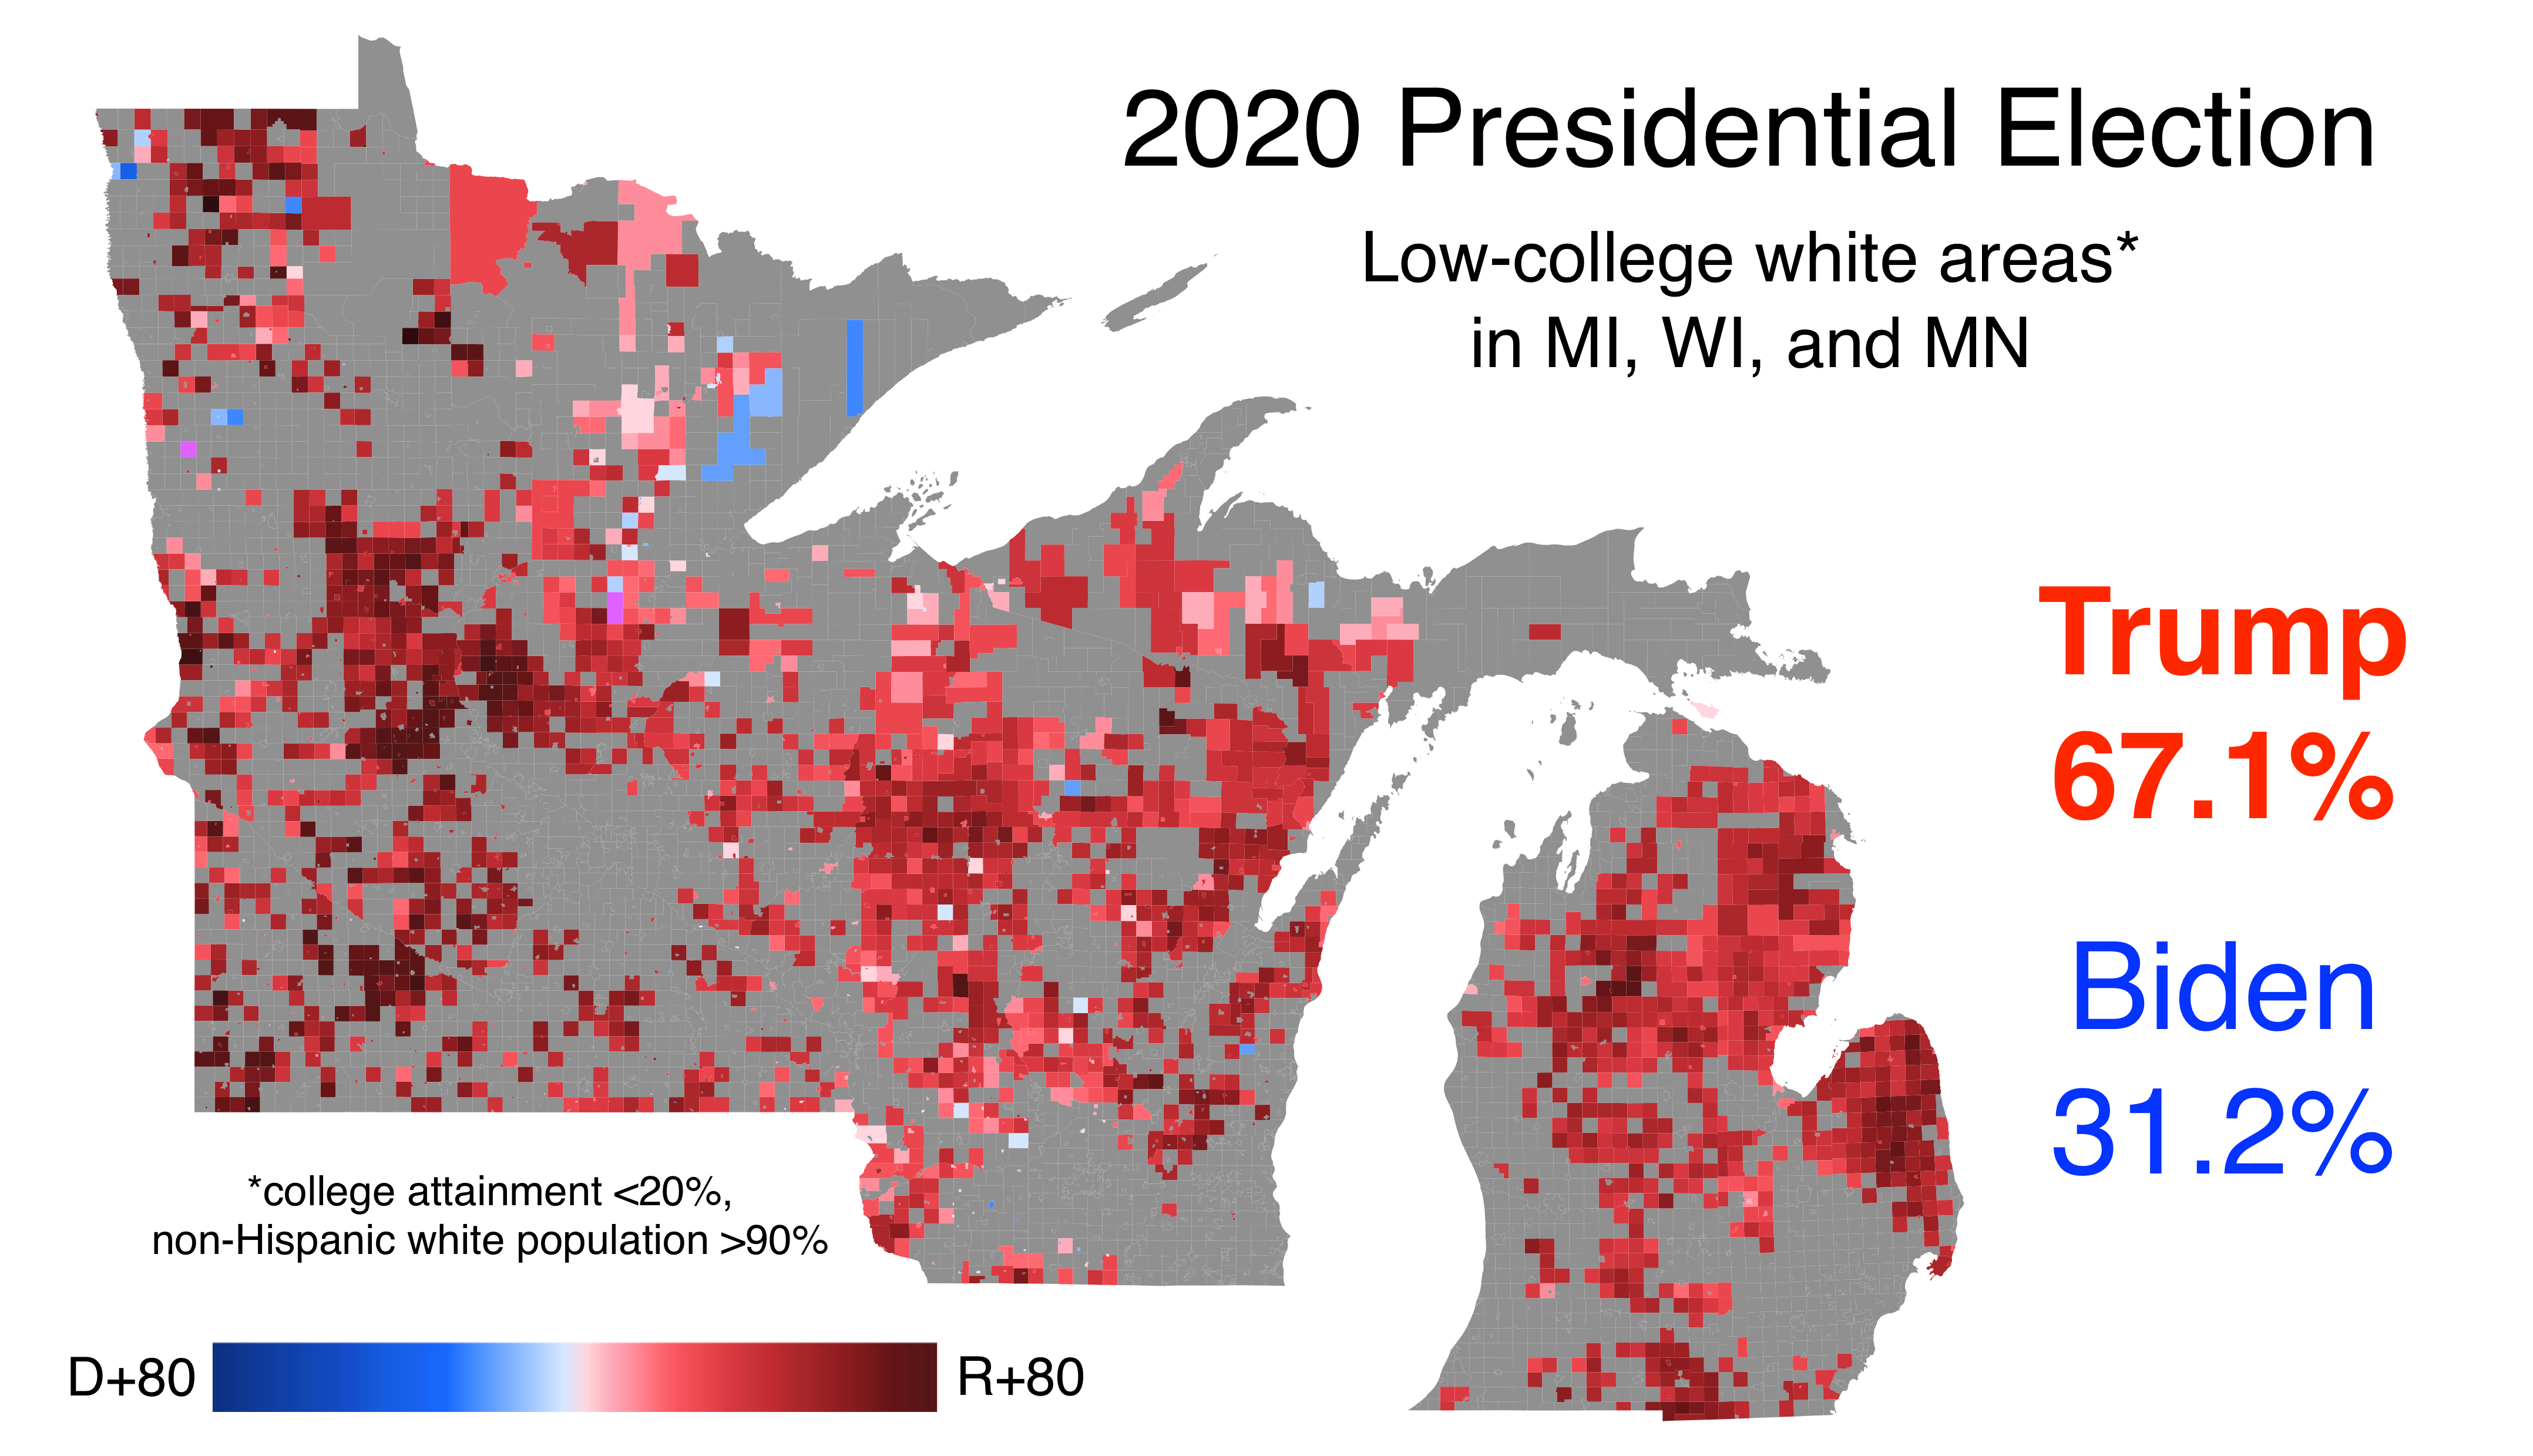
Donald Trump changed the U.S. electoral map in 2016 by producing huge movement toward him among white voters without a college degree. These maps show how places dominated by these voters in three upper Midwestern states that have historically voted for Democrats went from semi-competitive to blowouts for Trump.
A shorthand for Massachusetts’ countercultural centers
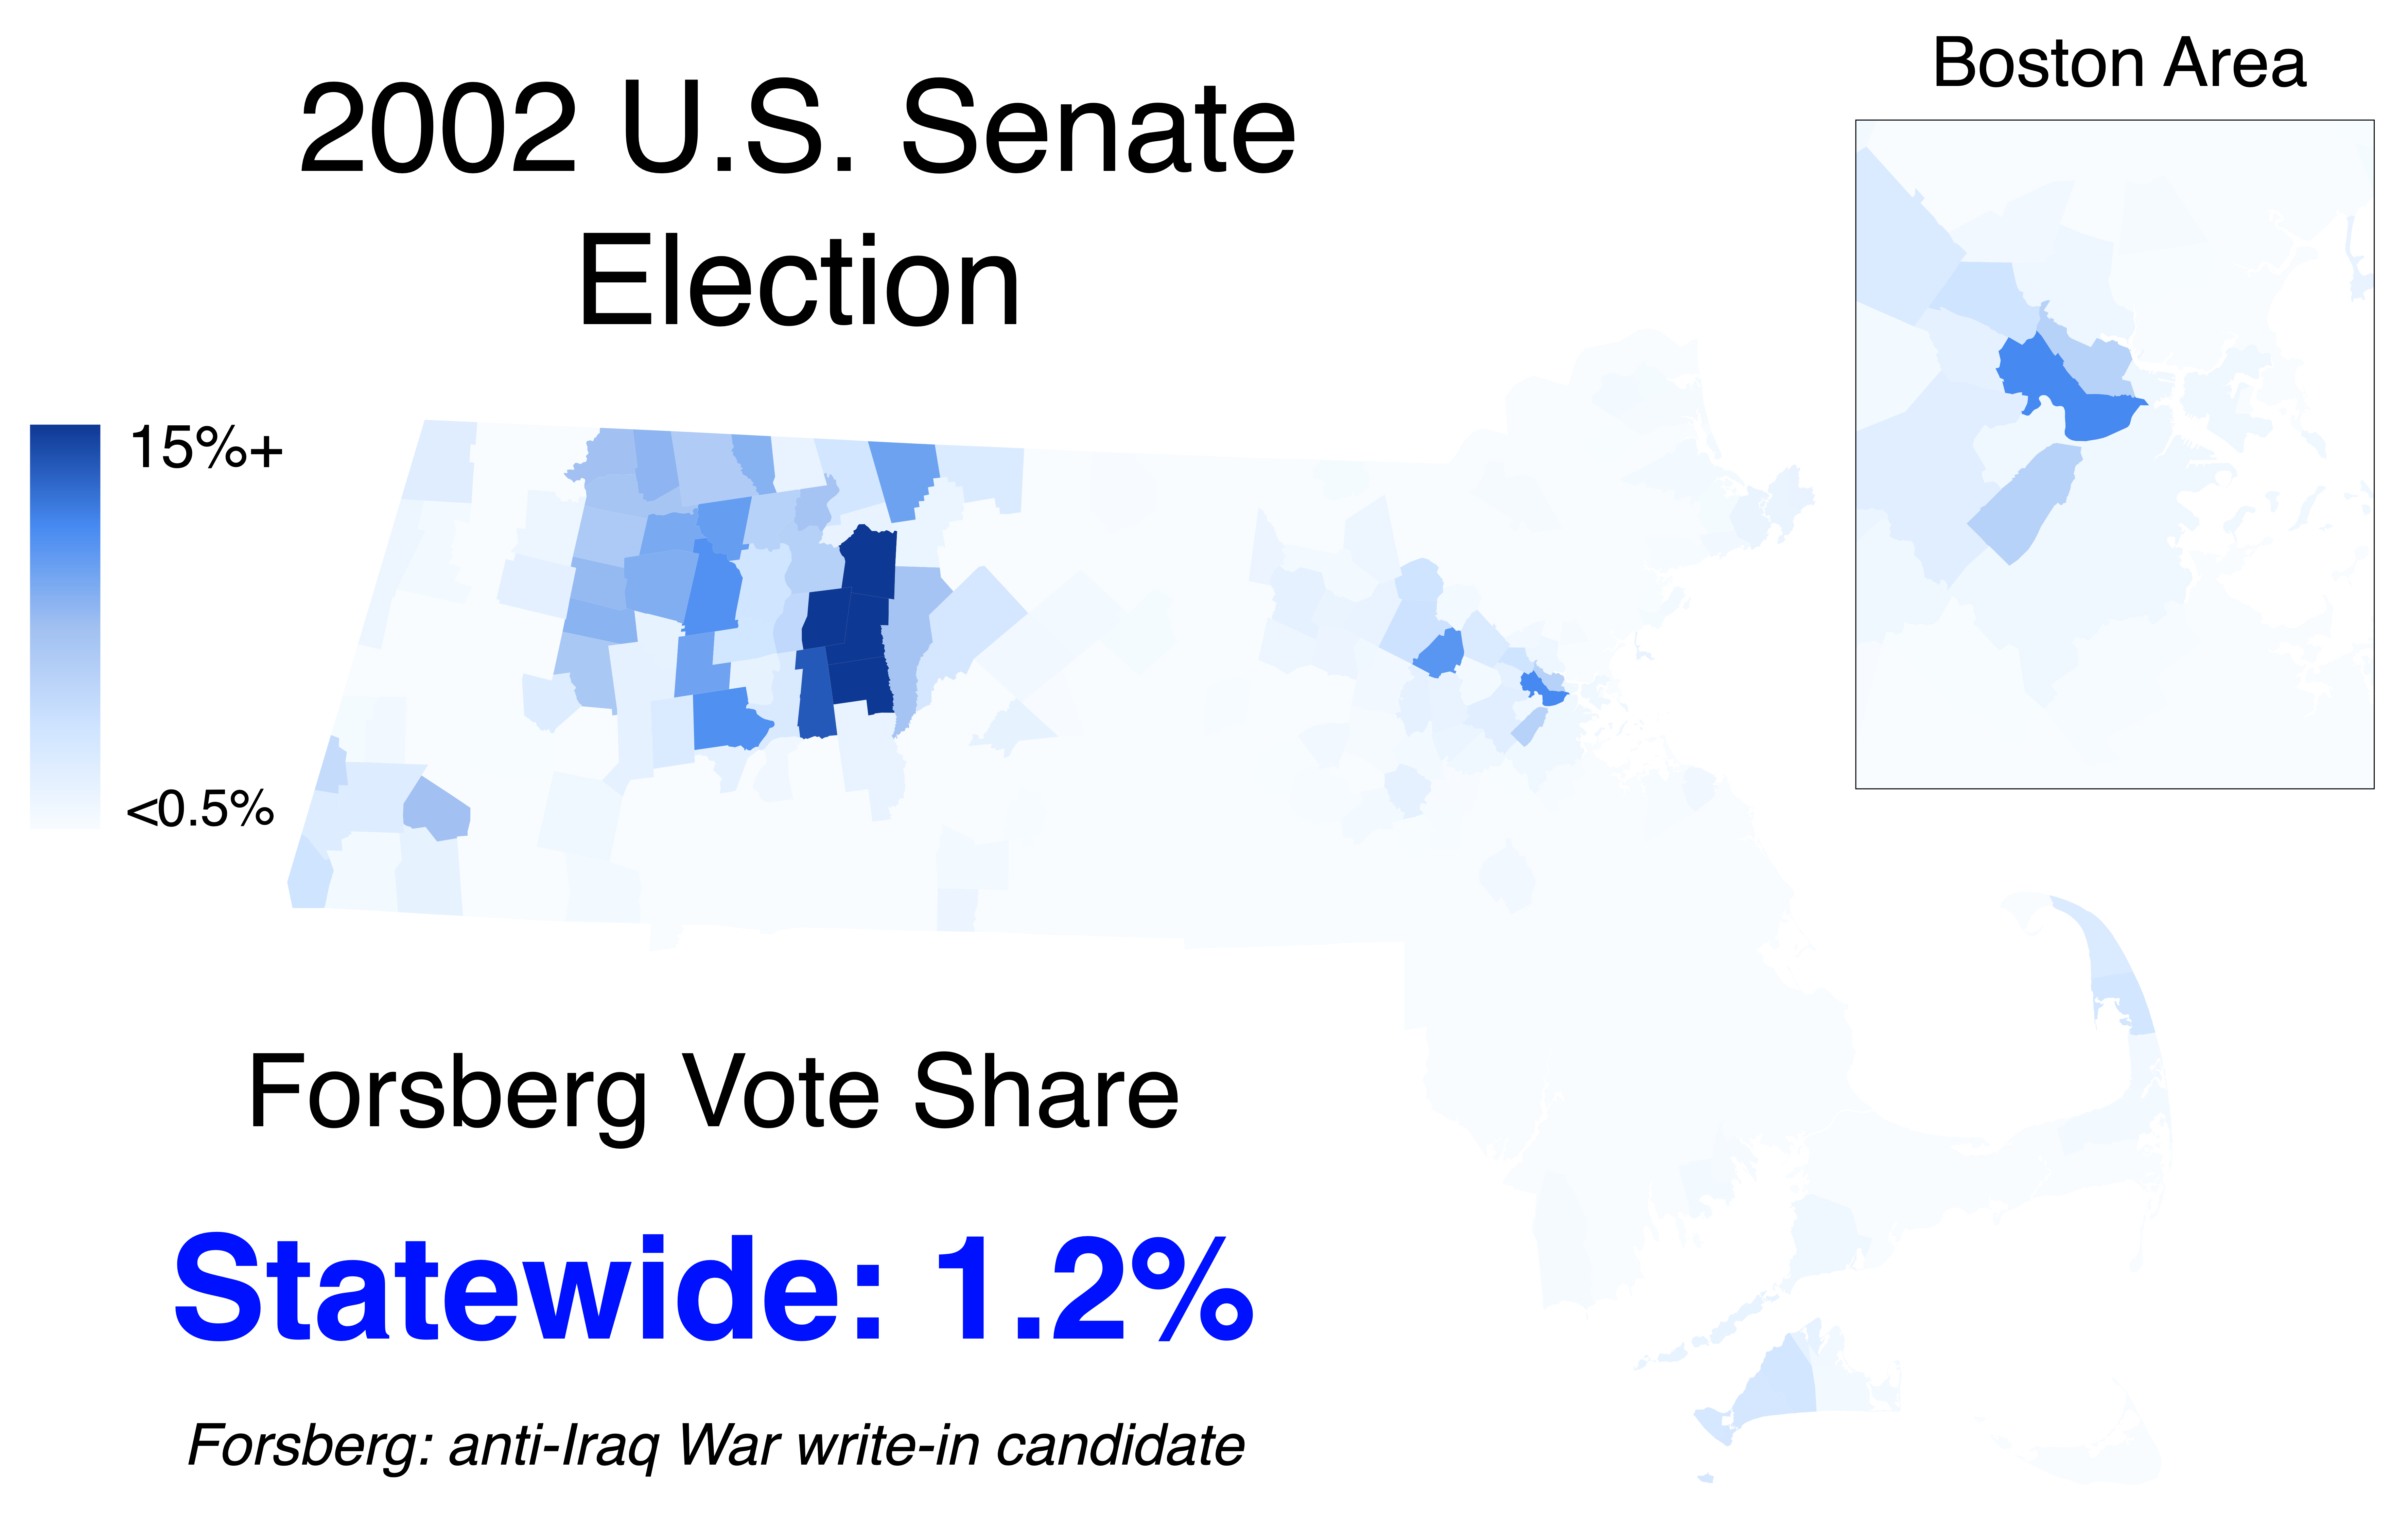
In 2002, Democratic Sen. John Kerry had no Republican opponent. However, the single-issue write-in campaign of Randall Forsberg, an anti-Iraq War activist, gained serious traction in the hill towns of the northern Pioneer Valley. This is the map I reference first when explaining to others that region’s historic countercultural lean (it also heavily supported Jesse Jackson in the 1980 Democratic presidential primary, a major outlier among majority-white places).
A case study in misleading New England county lines
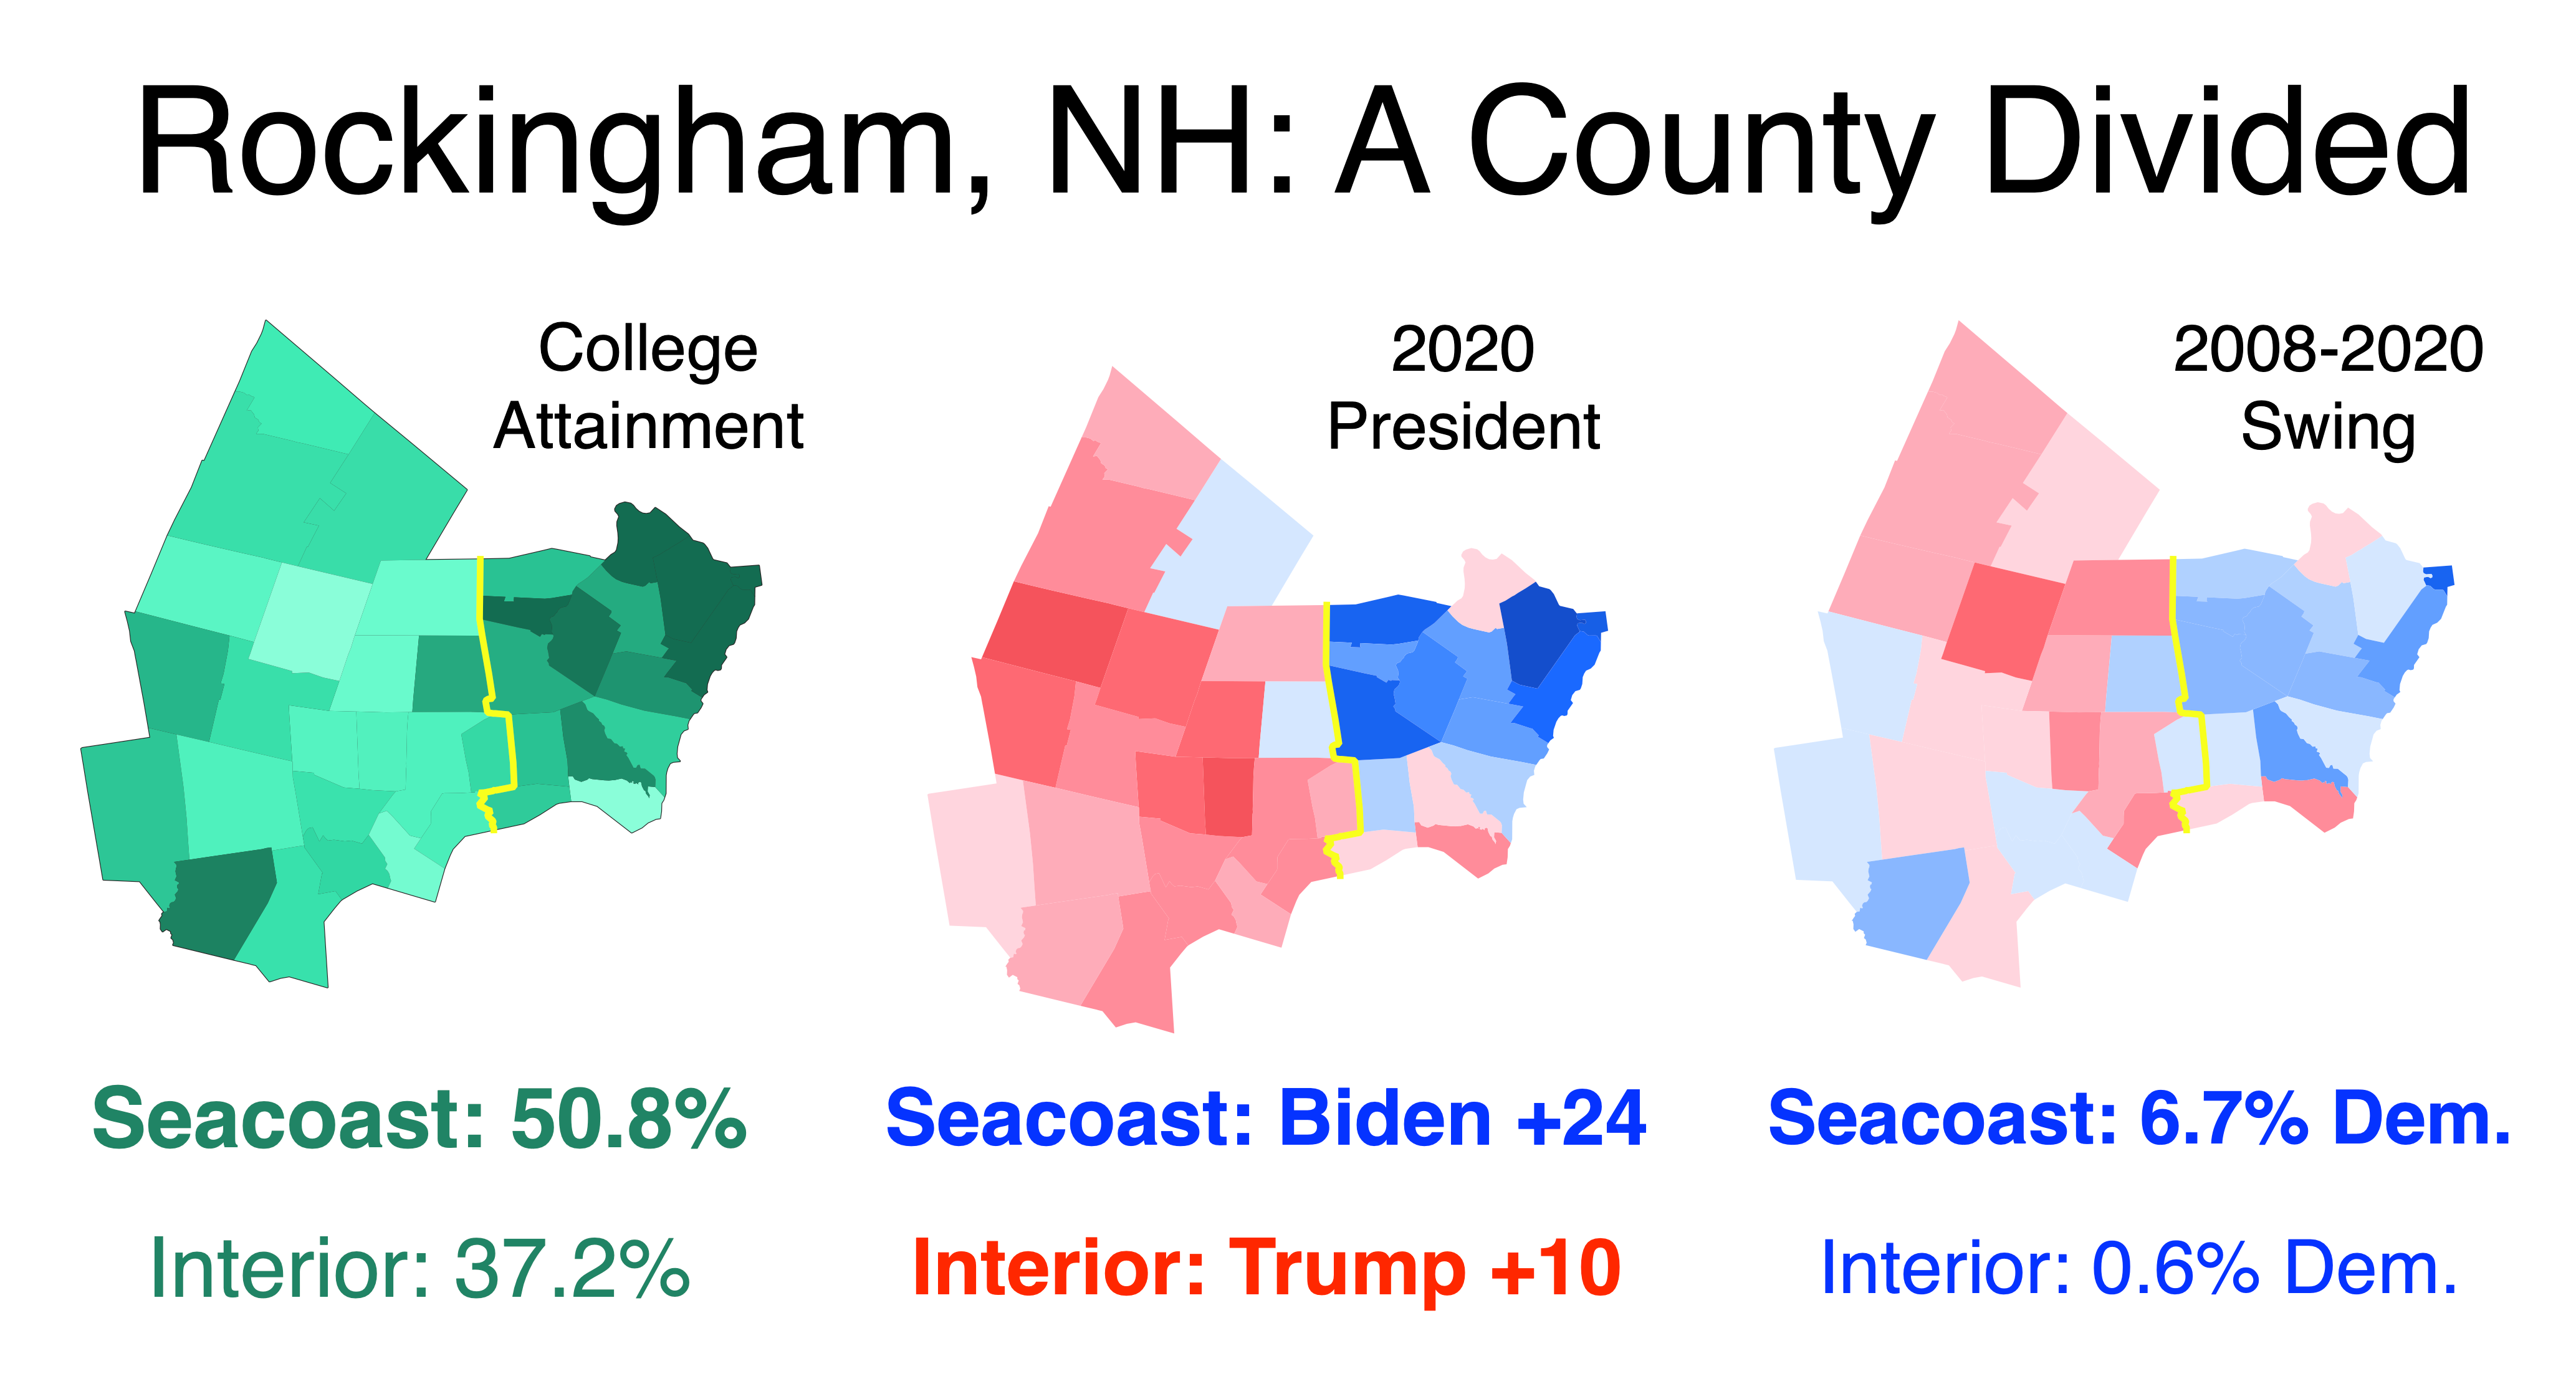
National analysts often point to counties to try to explain voting trends, but this approach usually proves inadequate in New England, which is organized at the town level even if county boundaries still exist. A prime example of this is Rockingham County, New Hampshire, which I’ve seen described as “moderate” — in reality, it’s sharply split between two cultural regions: the liberal, upscale Seacoast and the conservative interior. The two portions diverged by 34 points in 2020, and the gap is only growing.
Behind Nikki Haley’s loss in New Hampshire
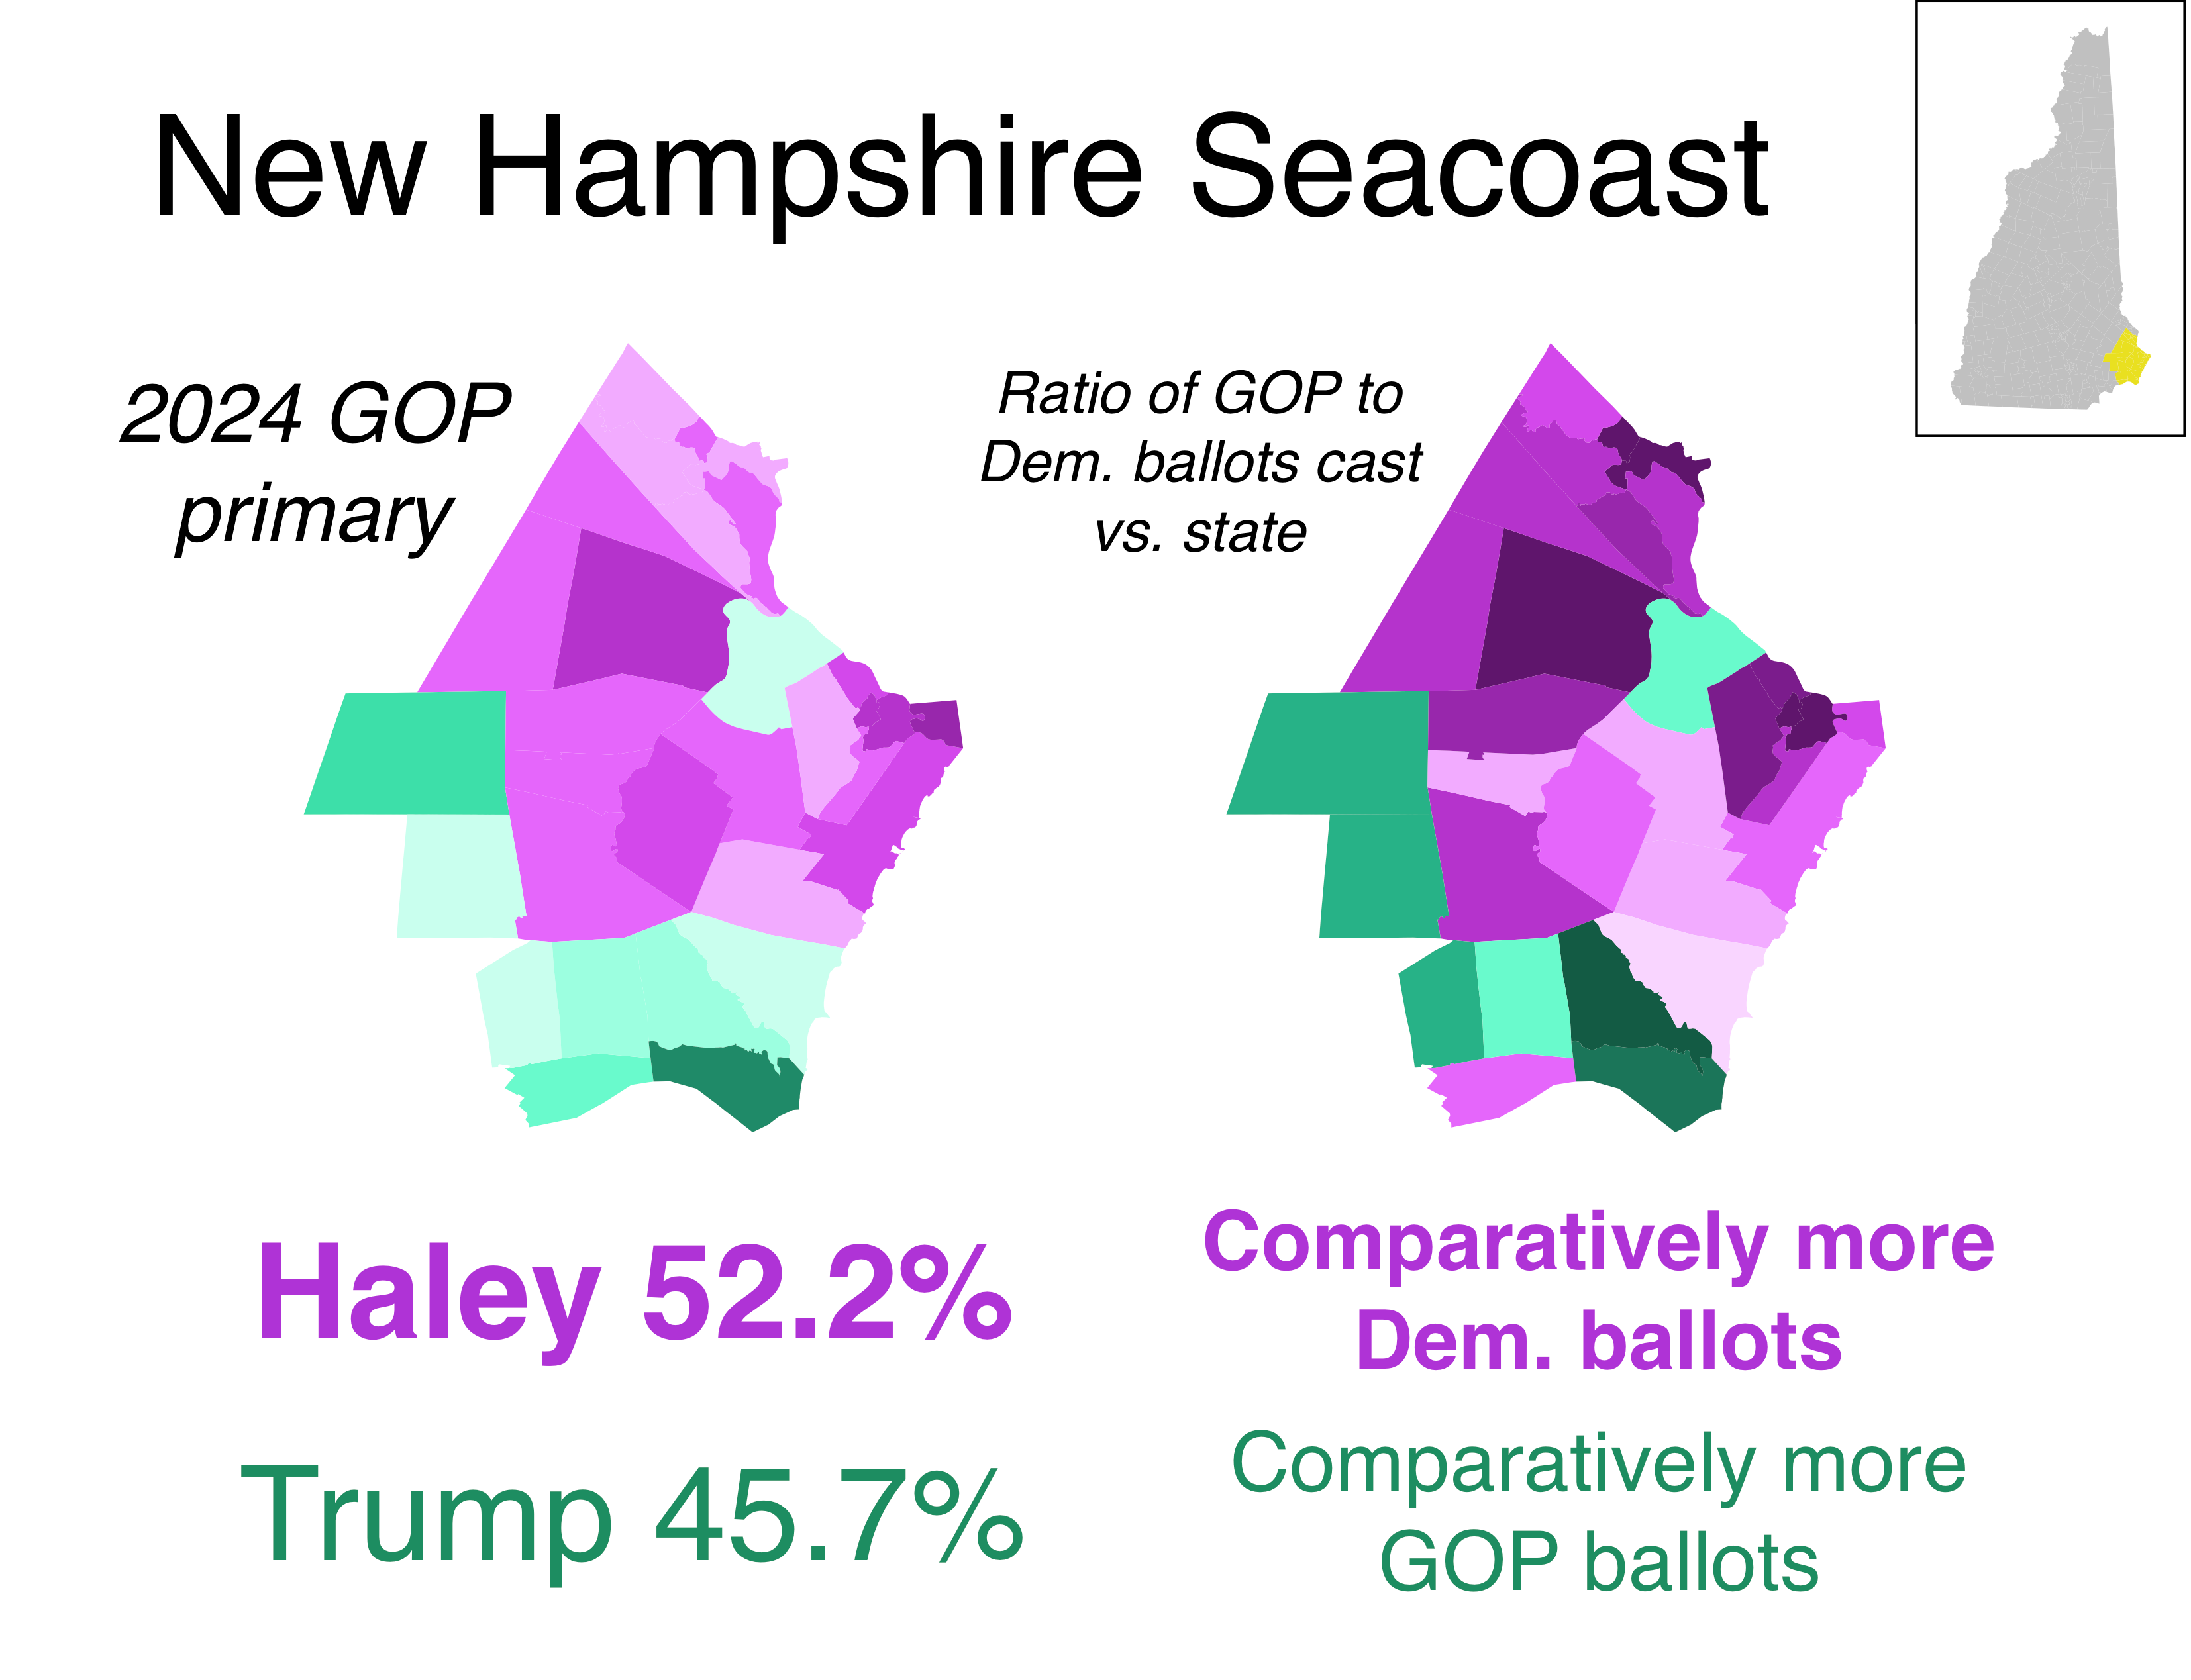
Nikki Haley couldn’t pull off the upset against Donald Trump in the 2024 New Hampshire Republican primary. The main reason for her defeat was her failure to energize enough Democrats to pull Republican ballots. The Seacoast region is a prime example: in its most Democratic places, like ultra-blue Portsmouth, GOP ballots barely outnumbered Democratic ones, despite Haley’s campaign heavily courting crossover votes.2
Where Mitt Romney struggled despite being at home
Owing to his past tenure as governor of Massachusetts, Mitt Romney generally did better than John McCain in New England. However, Romney was particularly weak in certain blue-collar areas, like Ohio’s Mahoning Valley. In the towns shaded pink, Romney backslid from McCain, then Trump recovered Republican fortunes — suggesting that Mitt was an especially poor fit.
Demographic maps
Where Massachusetts’ ethnic whites lived in 1910
In 1910, nearly one-third of Massachusetts residents were foreign-born whites. They were nearly a majority in industrial centers like Lawrence and New Bedford; the yachting hub of Marblehead sat at the other end of the spectrum.
How Hispanics in Massachusetts are distributed
I enjoyed this map because it captures two variables at once: each place’s most prominent Hispanic group as well as how Hispanic the place is. Unlike most of the U.S., the majority of Hispanics in Massachusetts are either Dominican or Puerto Rican, and they’re concentrated in post-industrial cities like Lawrence and Holyoke.
Income and education in the Boston area
Another one I’m including because I liked designing the layout, this map buckets towns in the inner Boston metro by median household income and includes college attainment as a reference. Note that MetroWest is both affluent and high-college, whereas towns east of Route 3 have more middling college attainment despite still being quite wealthy. Also note that no town in the area has a median income below $70,000 — this is a wealthy metro area by any standard.
Income and education in New England
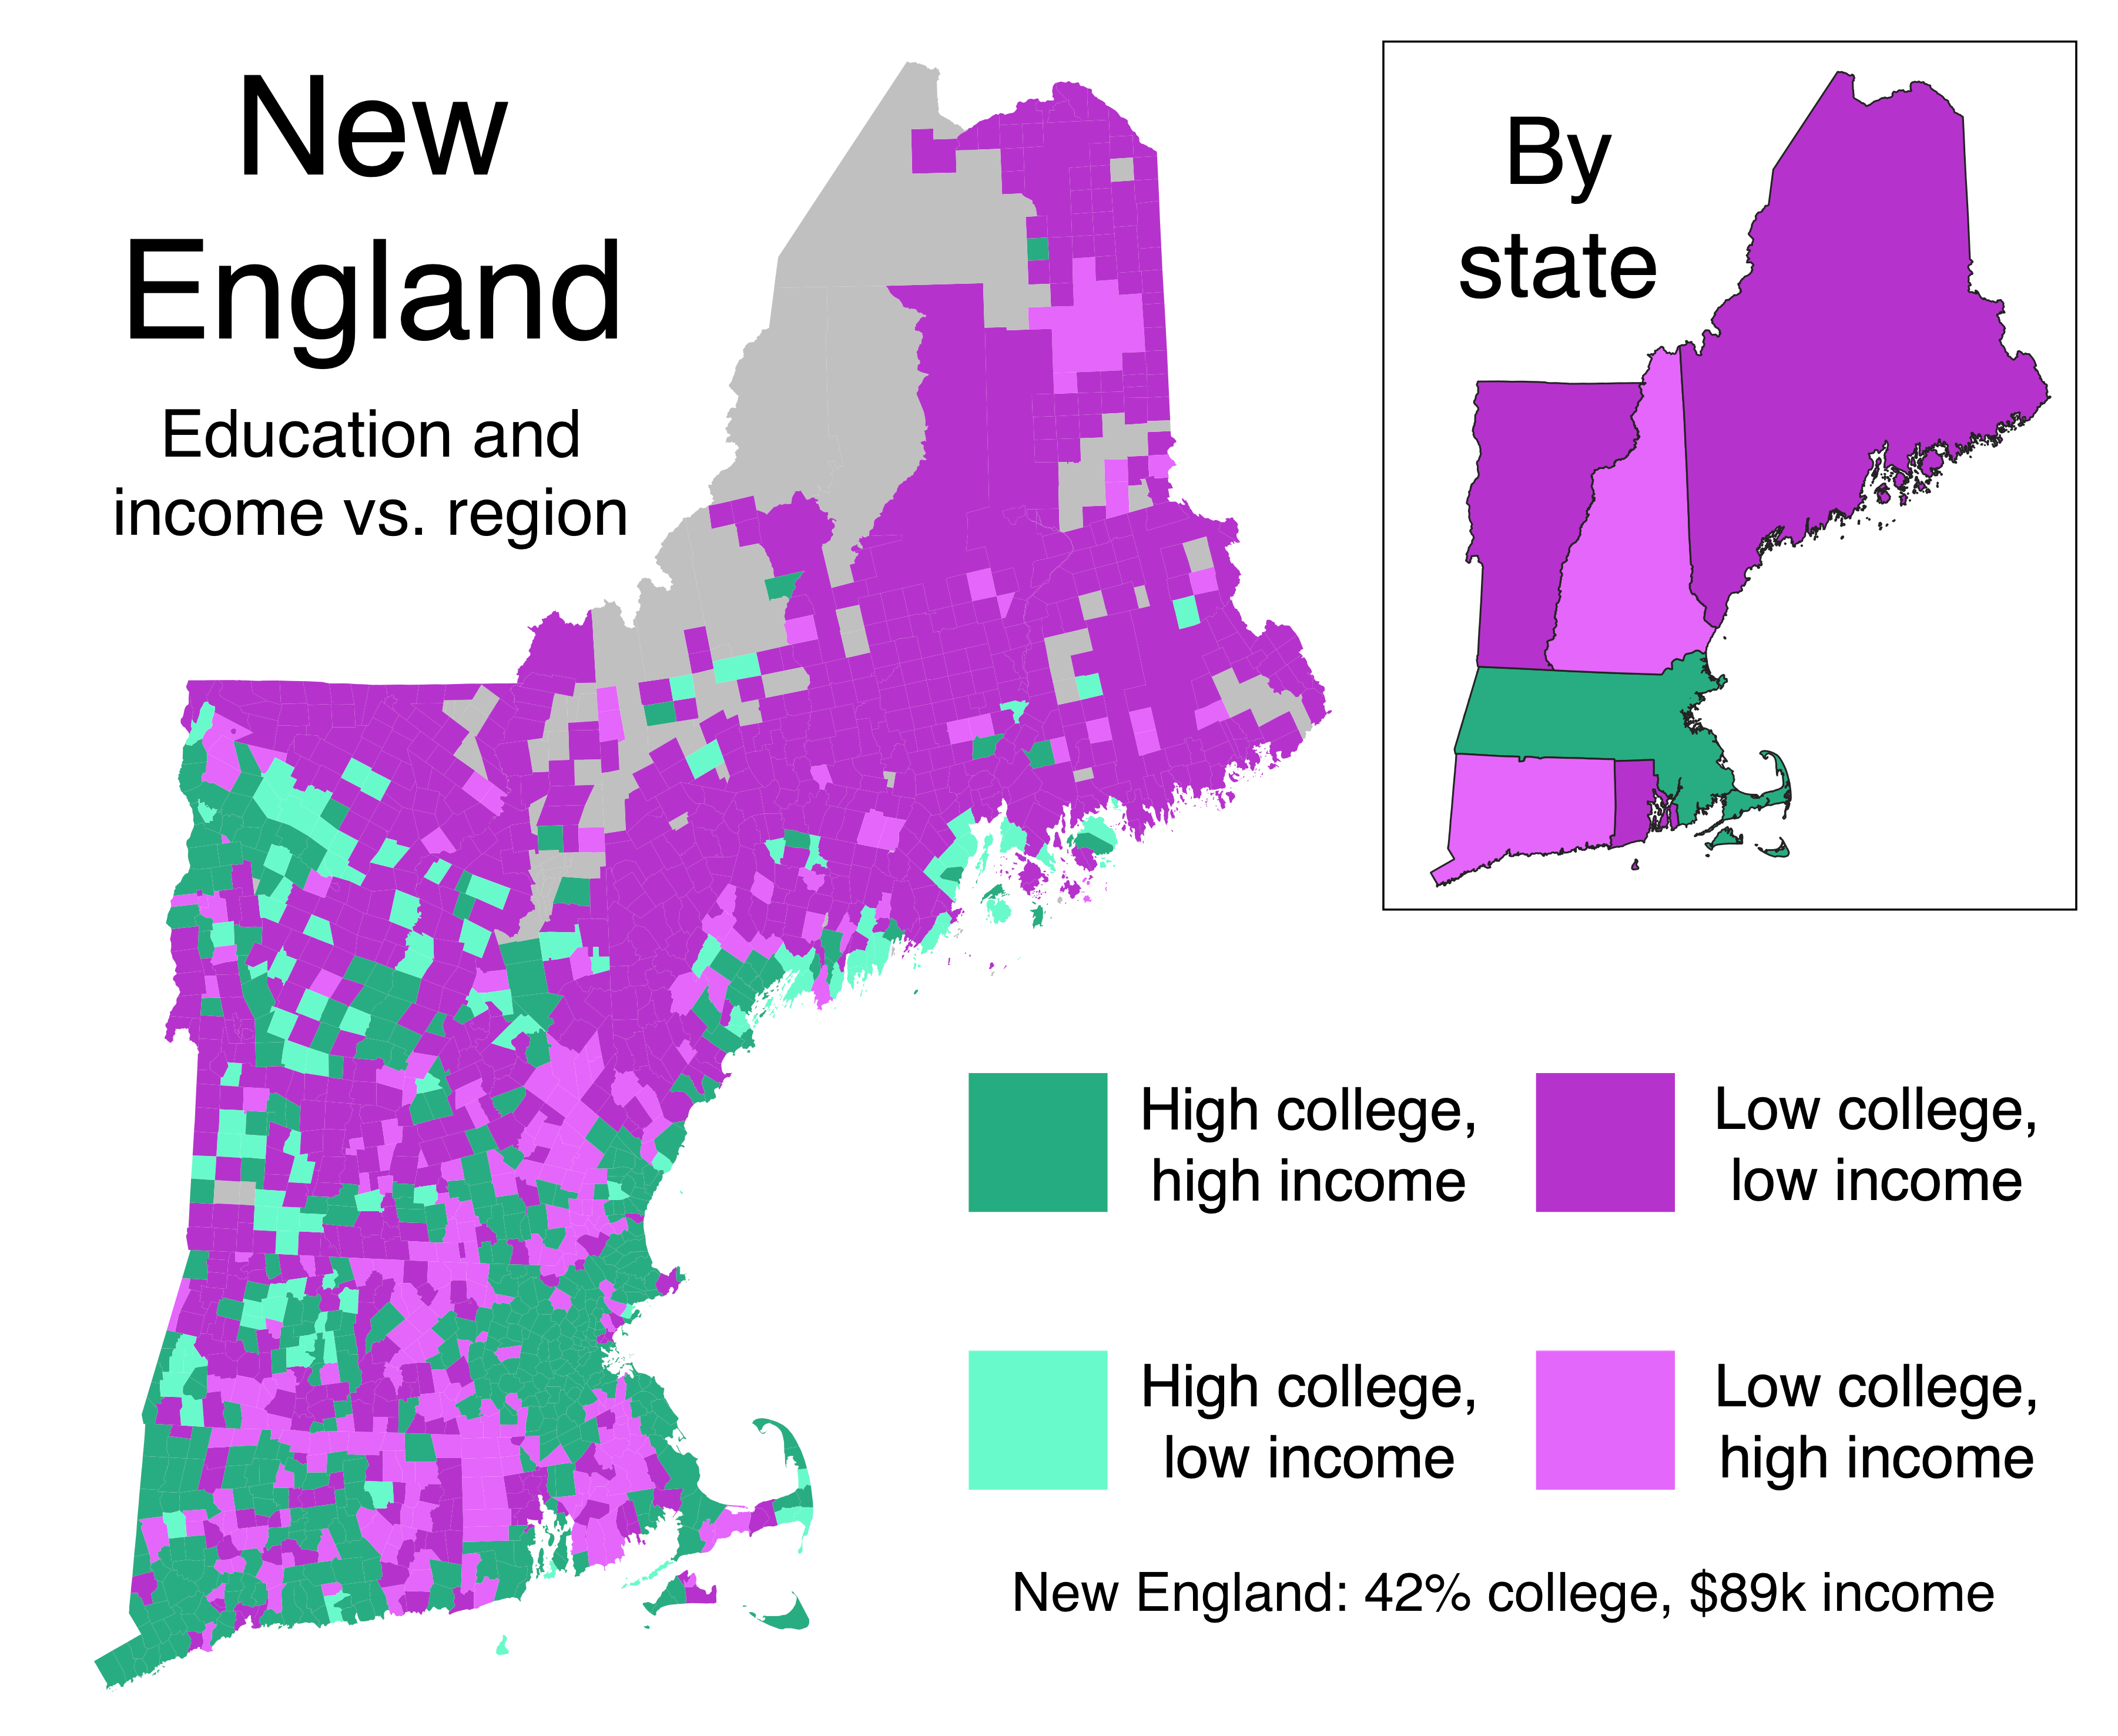
Breaking out areas by both education and income helps further illuminate patterns. For example, while Donald Trump has made gains in low-college areas all across the country, politicians in his mold have fared especially well in low-college, high-income areas.
In contrast, Democrats have been making gains in high-college areas everywhere, but the most left-wing candidates generally perform better in high-college, low-income areas.
Where Irish and Italians marry each other
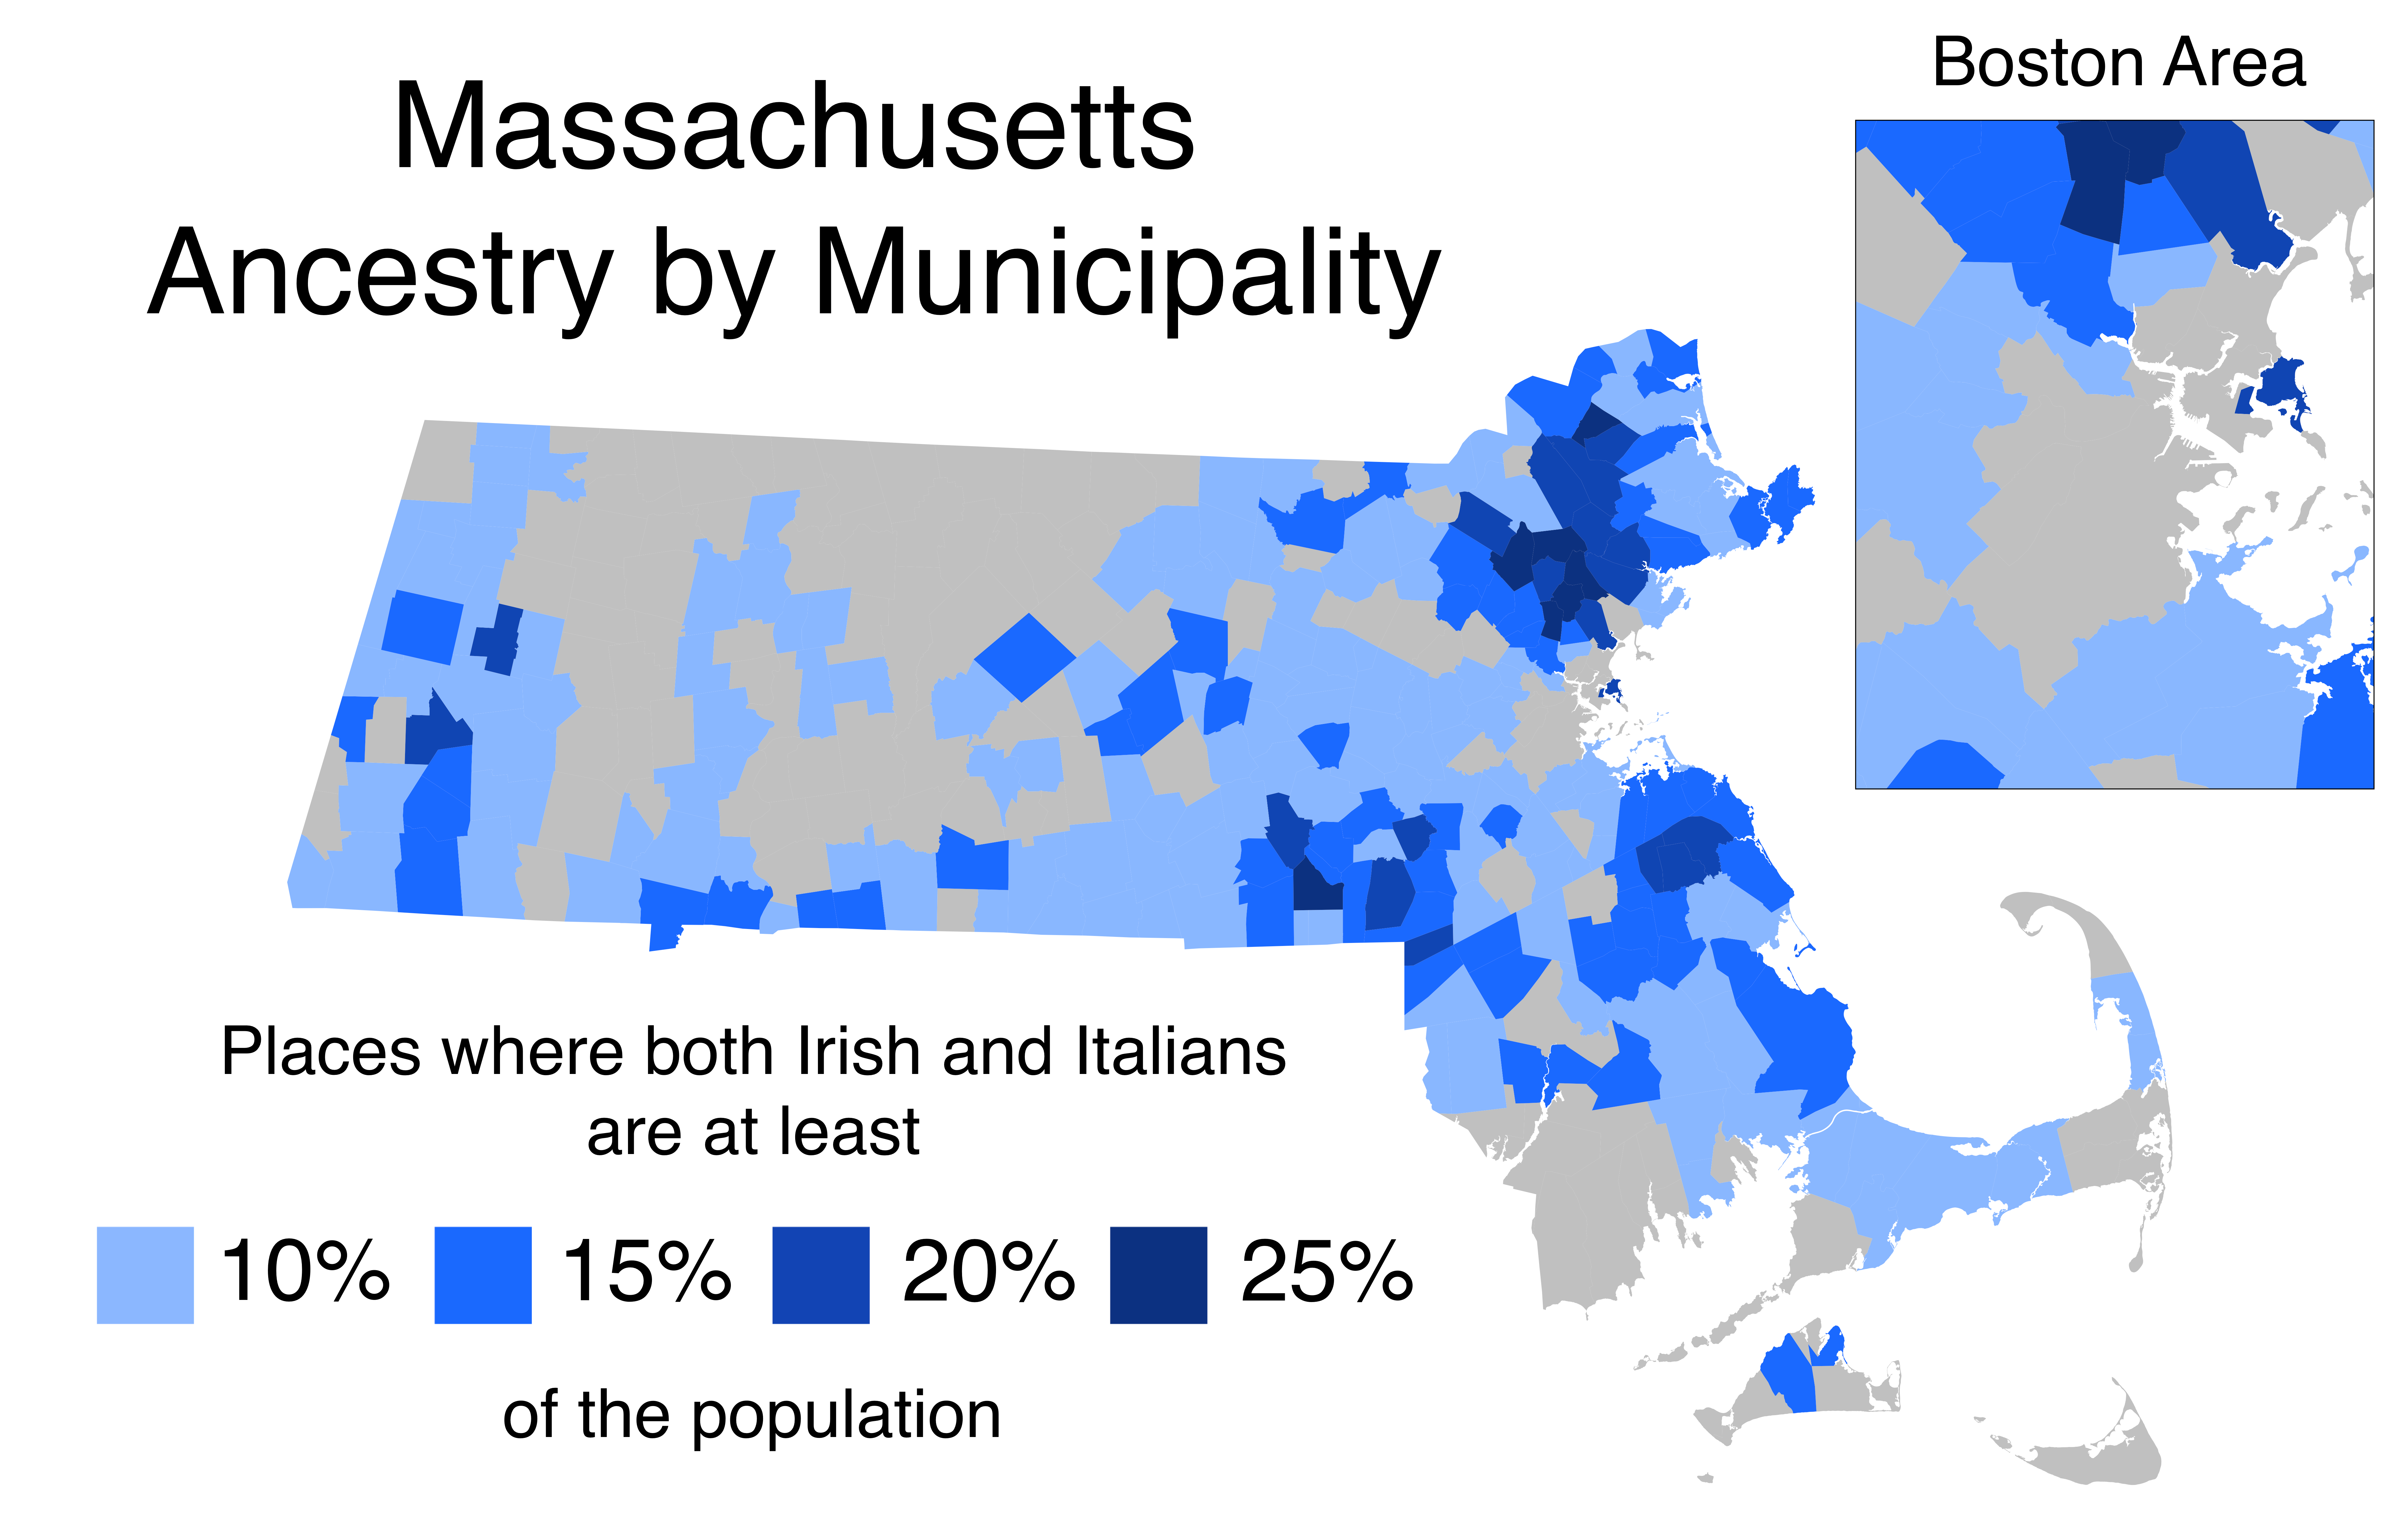
This is basically a guide to the most “townie” places in Massachusetts, the kinds of places where thick non-rhotic accents are the norm and rough-around-the-edges tradesmen congregate in riotous sports bars. It’s the Boston you see in movies - only it’s not in Boston anymore.
How New England’s most common ancestries are distributed
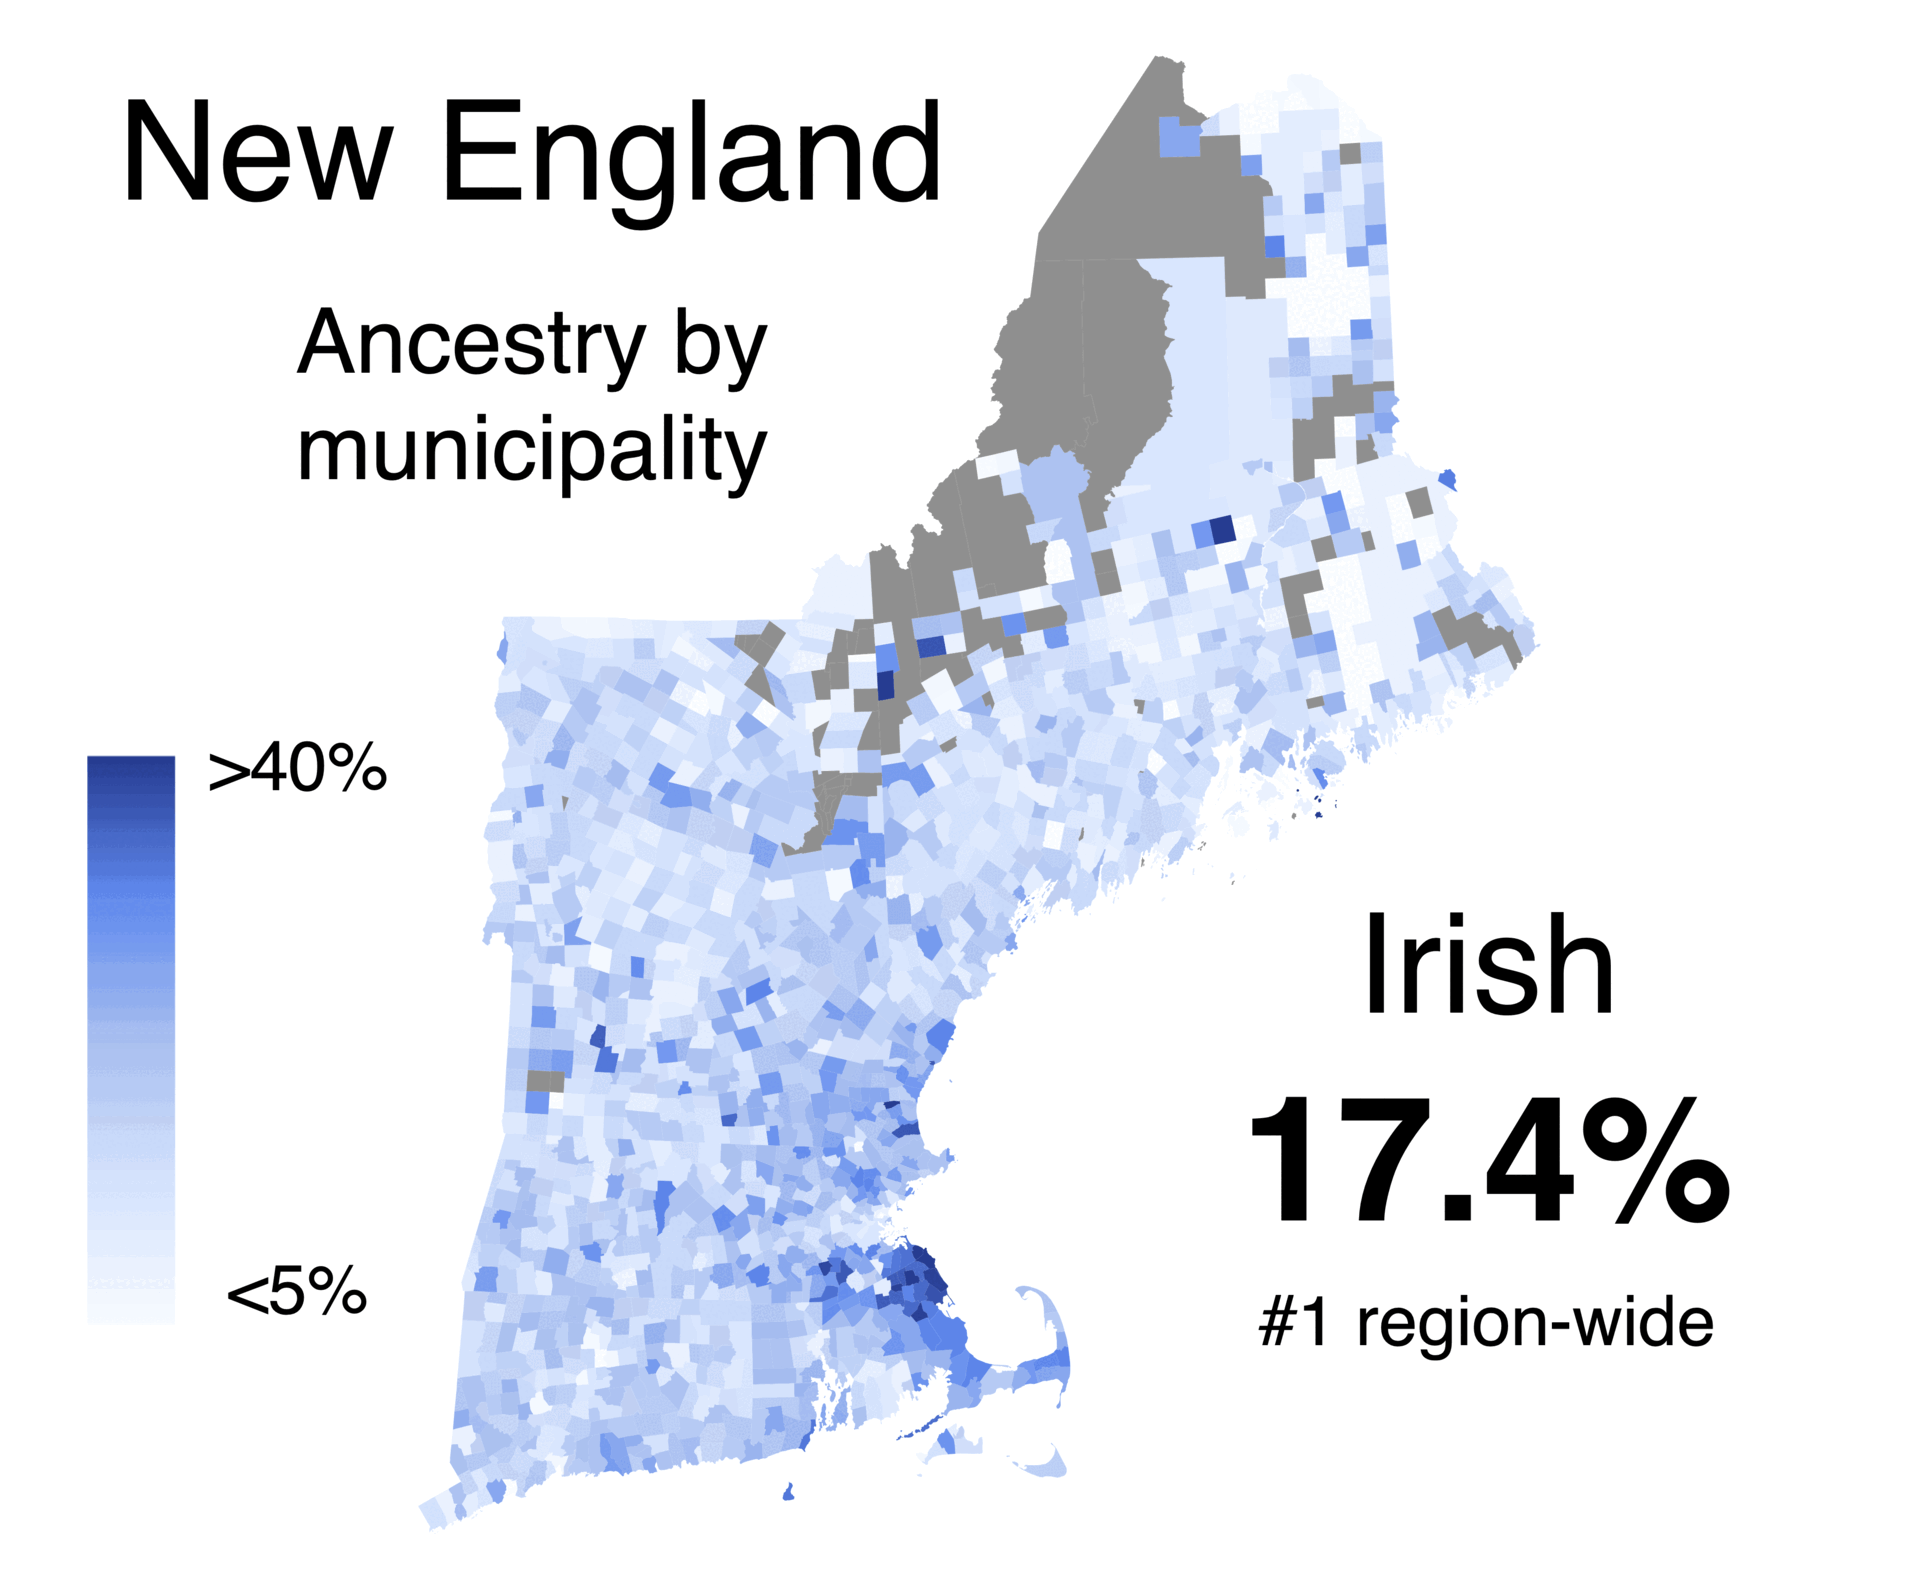
This GIF provides an overview of New England’s demographics. Unlike America as a whole, where German is the most common ancestry, Irish and Italians dominate New England. The Irish are well-represented almost everywhere in the region, but they’re most heavily concentrated along Massachusetts’ South Shore; Italians are prevalent in southern Connecticut.
As you’d expect, French-Canadians are clustered along the northern borders of Vermont, New Hampshire, and Maine, but they also have enclaves in central Massachusetts and Connecticut’s Quiet Corner. In traditionally Yankee areas like downeast Maine, the northern Pioneer Valley, and Cape Cod, English ancestry remains common. Portuguese-Americans are extremely concentrated in southeastern Massachusetts.
Statewide, GOP ballots outnumbered Dems' by 2.6x; that number was cut to 1.1x in Portsmouth.